
What Would Cause the Ultimate Pain? A S&P500 Rally to 6000.
The Bull Case for Equities, Falling 30Y Yields, Crowded Short Positioning in Crude Oil, and Why It Might Be Time to Go Long USD Against EUR and JPY.

Hi everyone,
This article is structured in three parts: first, I lay out the bullish case for equities, then I discuss new trades, and finally, I share thoughts on 30-year yields, oil, the Euro, and the Japanese Yen.
These write-ups take a lot of time and effort to put together, so if you find them helpful, I’d really appreciate it if you shared them, forwarded them to a friend, or posted them on X. It keeps me motivated to keep doing the work and putting these pieces out regularly. Having said that, let’s dive right in!
Will the S&P500 go to 6.000?
I mainly follow macro accounts on X, and right now, it feels like sentiment is bearish. Economists warn of a recession if tariffs remain in place, while investors expect new lows in equity indices due to overly optimistic earnings expectations.
It’s easy to find macro charts supporting this view, but at this point, they don’t add much new information. Despite a steady stream of Trump-related headlines, the big picture remains unchanged: (1) tariffs are still in place, and (2) meaningful trade deals will take time.
In the long run, equities tend to drift higher as the global economy - and by extension, corporate earnings - continue to grow. For stocks to enter a prolonged downturn lasting one to two years, we would need a constant flow of growth-negative news that push investors out of equities.
If the worst news is already behind us, equities are unlikely to decline much further. For a deeper selloff, we would need negative catalysts, such as a deterioration in labor market data or a significant escalation in the trade war.
So far, the hard data doesn’t show meaningful deterioration. The NY Fed’s GDP forecast is running at 2.6% for Q1 and 2.7% for Q2. Meanwhile, this week’s Redbook sales rose 7.4%, reflecting continued strength in the US consumer.
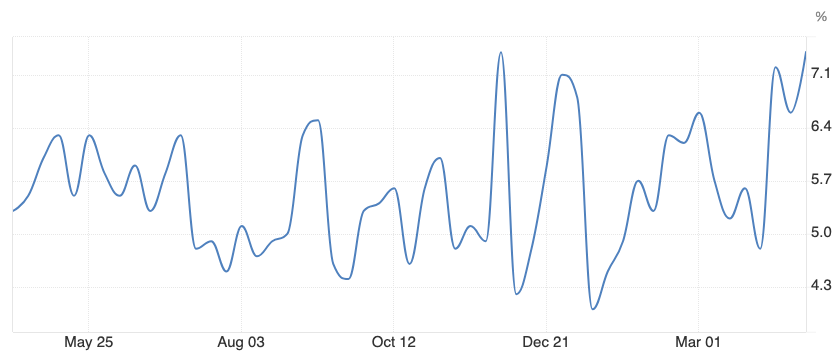
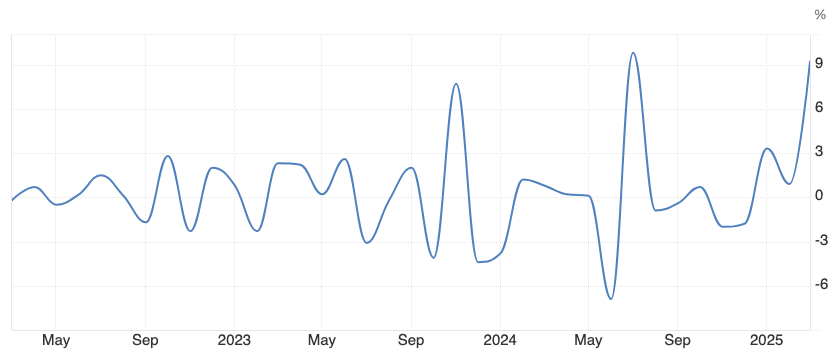
Durable goods orders rose 9.2% month-over-month, far exceeding the 2.0% consensus estimate. While the headline number is likely distorted by tariff front-running and seasonal effects like Easter, the broader picture suggests the US consumer remains in healthy condition.
The economic expansion over the past two years has been driven by higher incomes. Today, wage growth is running at 4.3%, while inflation sits at 2.4%, meaning real incomes are growing by nearly 2% per year.
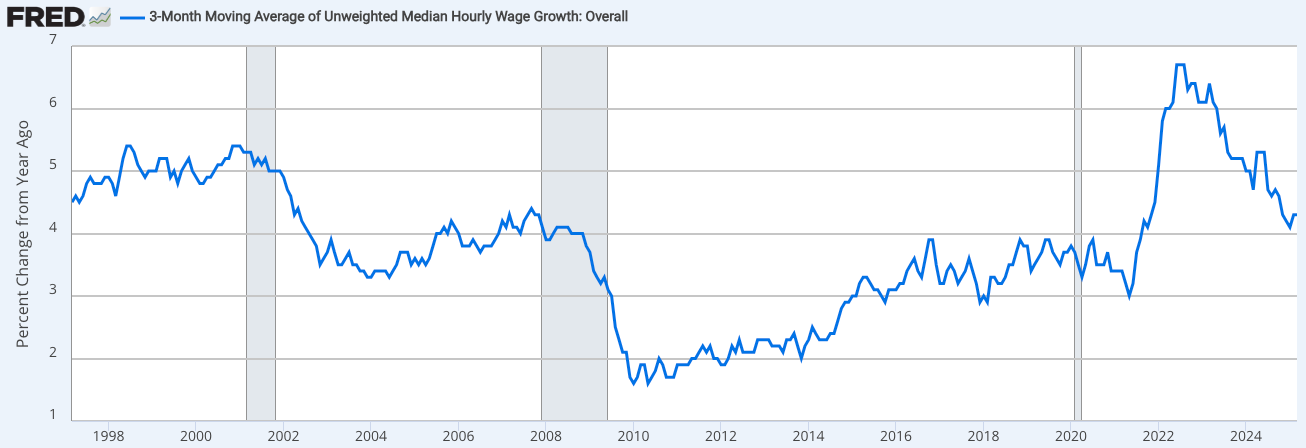
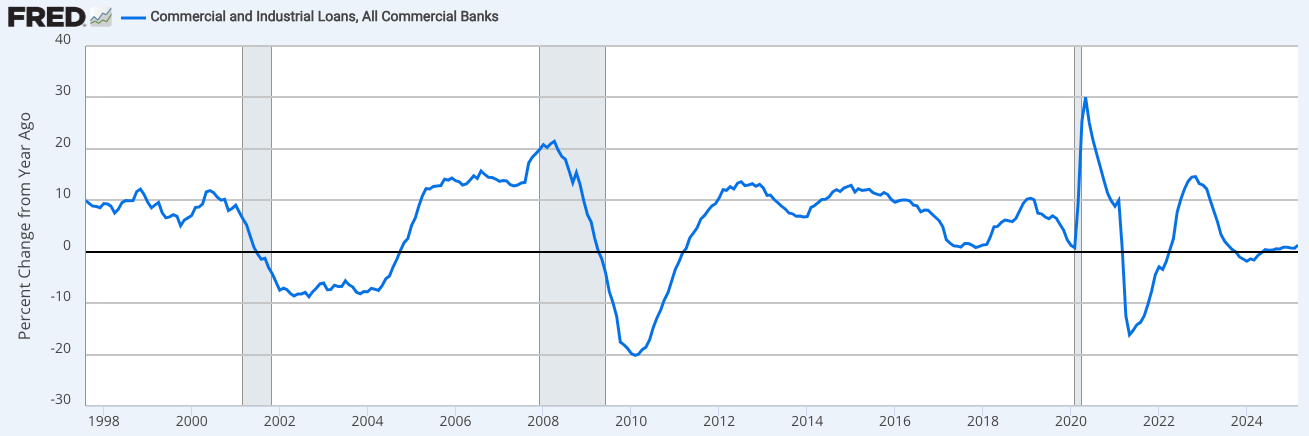
Credit has not been the driver of the economic expansion over the past two years. Growth in commercial and industrial loans is running close to 0%. Instead, real incomes are growing by nearly 2% per year — arguably a more stable and sustainable source of economic momentum than a credit boom.
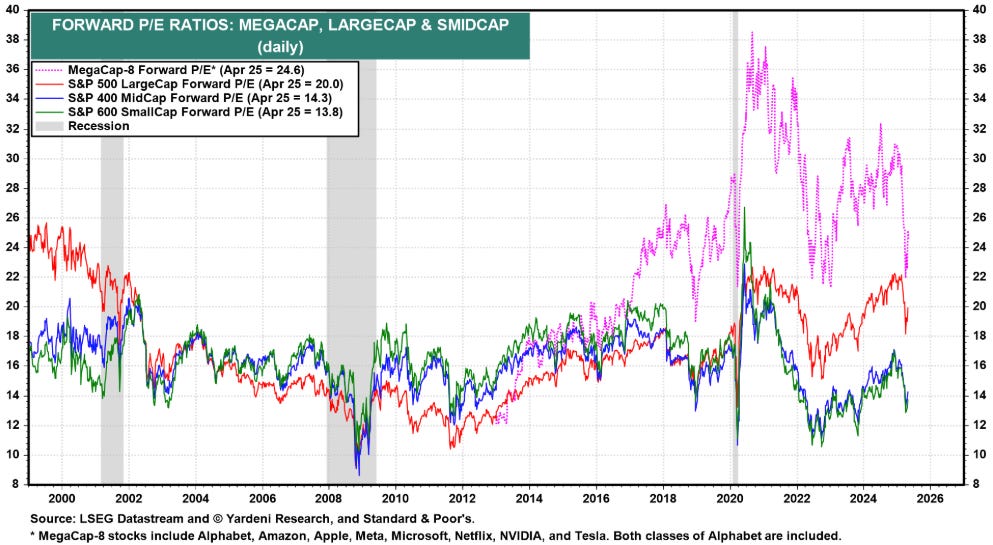
Let’s take a look at equity valuations and earnings expectations. Valuations have come down: the S&P 500 forward P/E is now at 20x, and the Magnificent Seven’s forward P/E has fallen to levels last seen during the COVID pandemic.
S&P 500 earnings estimates for 2025 have been revised lower by 5%. 3M, for example, announced that it expects tariffs to reduce 2025 EPS by 3–6%, roughly in line with the revisions seen so far. This raises an important question: are top-down analysts too bearish, and have bottom-up EPS estimates already priced in the tariff impact?
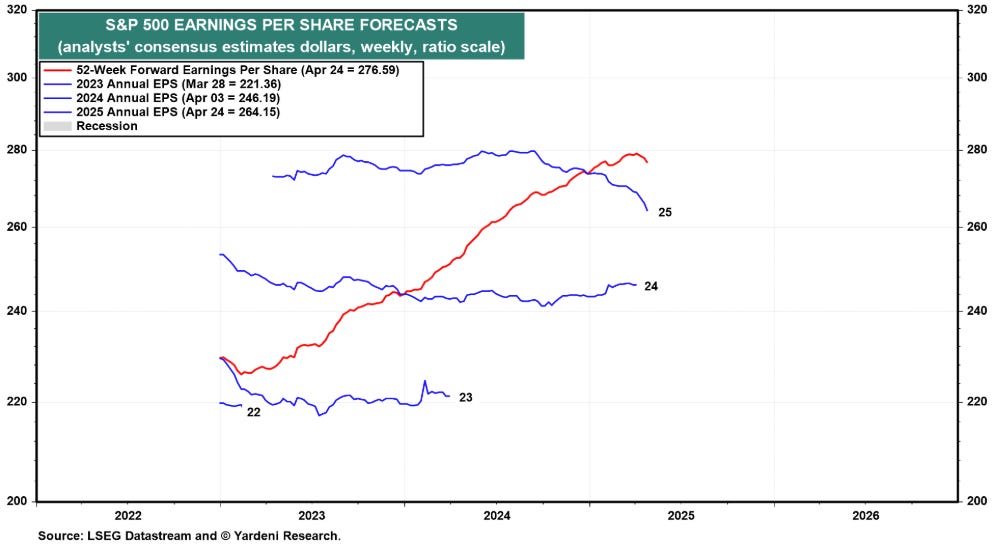
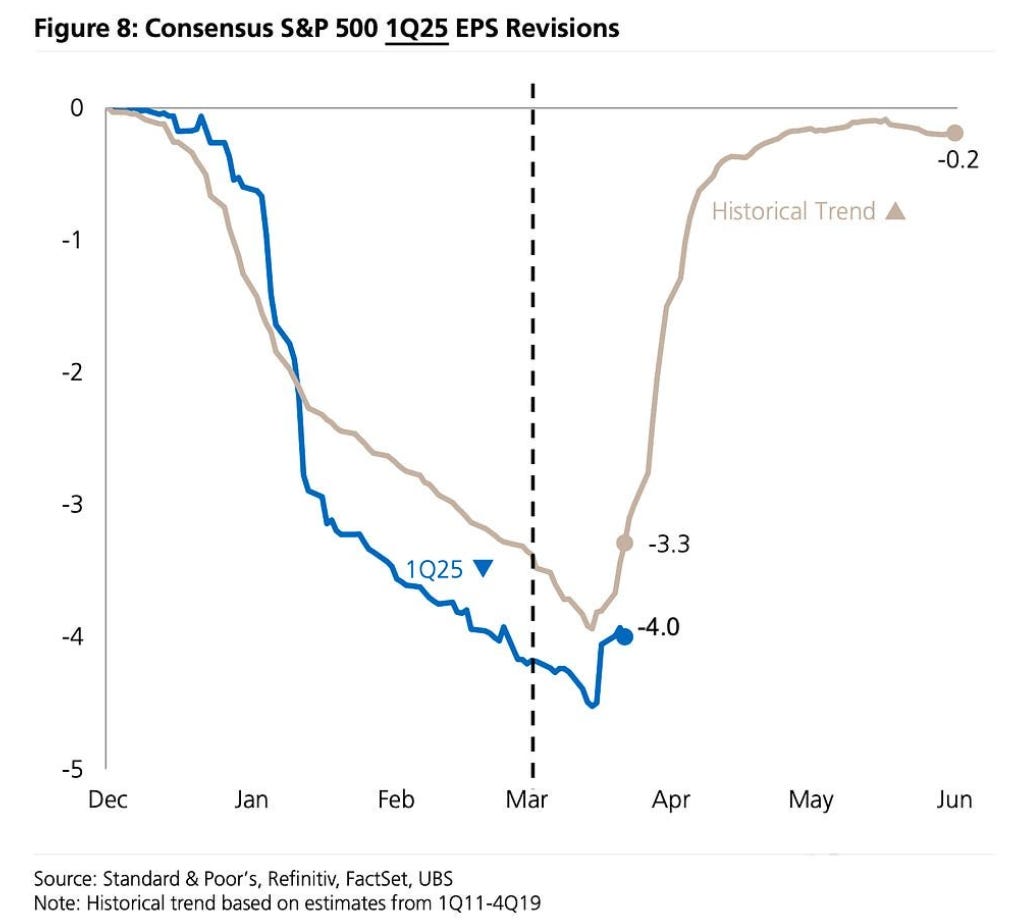
Earnings revision seasonality is turning positive. If earnings expectations stabilize - or even start to rise - the market could be caught wrong-footed. That would also make forward P/Es look cheaper, providing further support for equities.
Source: Maverick Equity Research on X
We also received some technical and sentiment buy signals. On Thursday, a Zweig Breadth Thrust triggered. Historically, three months after such a signal, the S&P 500 has traded an average of 8.64% higher, with 81% of observations (n = 17) positive.
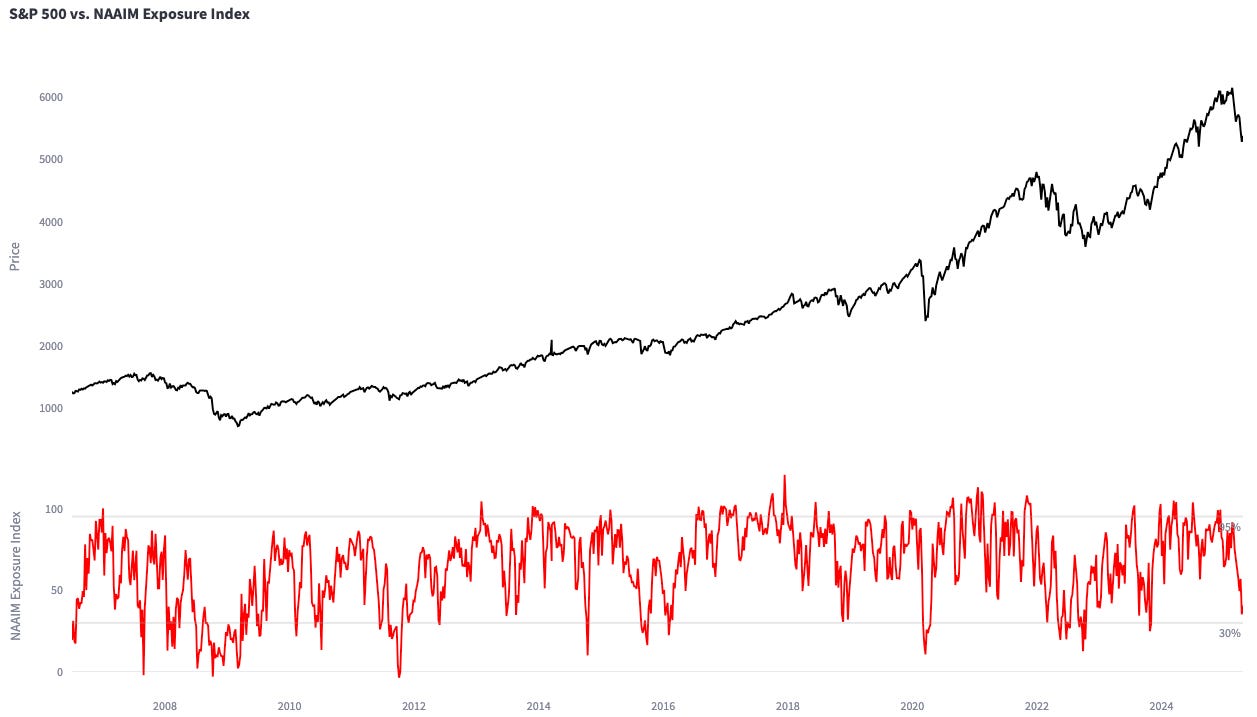
Meanwhile, the NAAIM Exposure Index is at 40, suggesting that fund managers will have to chase the market higher if it rallies from here. For active managers, there are few worse feelings than underperforming the benchmark right out of the gate.
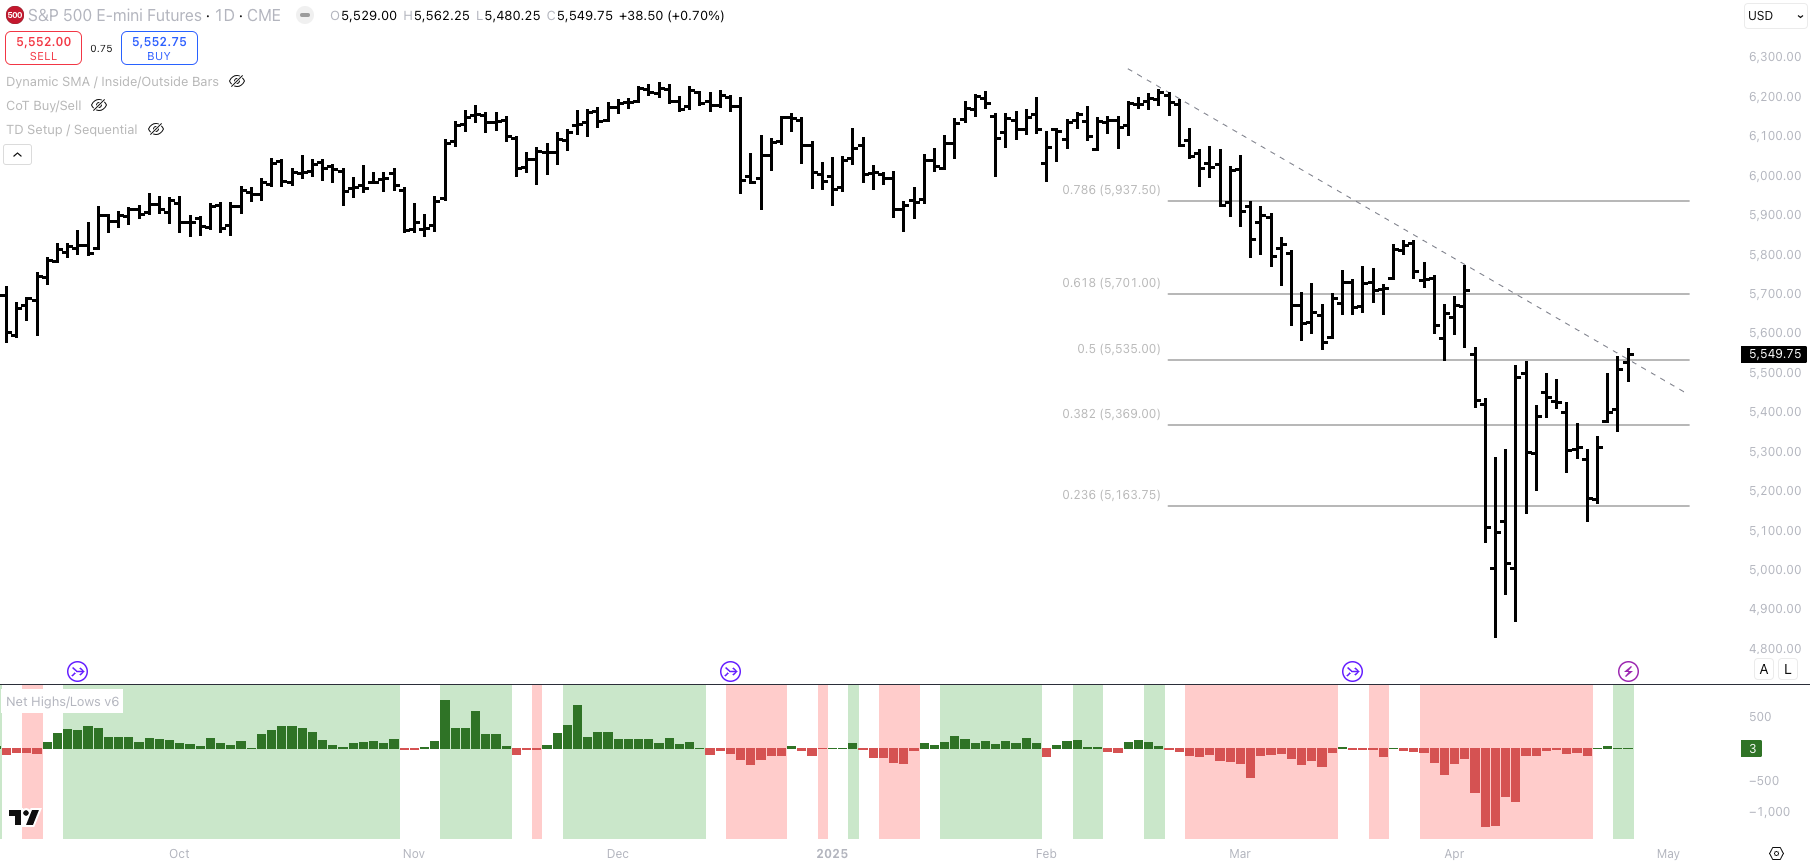
Investor sentiment, as measured by the AAII survey and the Fear & Greed Index, is decidedly bearish. Yet, breadth indicators - such as net 52-week highs/lows across the Nasdaq and NYSE - are showing improvement.
Portfolio Management and Trades
I’m a trader, not an economist, so I don’t concern myself with whether my economic views are right. The U.S. might or might not enter a recession - but what matters to me is P&L. On April 12th, I wrote, "The pain trade in equities is higher." I still believe that if the S&P 500 rallies to 6,000, many investors will be caught offside.
In my trading portfolio, I’m long oil and long the S&P 500. I entered the oil position on April 16th and will stop out if the price breaks the April 16th low on a closing basis. I went long the S&P 500 on April 24th and will stop out if the low is broken on a closing basis. So far, the trading portfolio is up 4.1% YTD.
If I get stopped out, I expect to lose around 2.0–2.5%. If the portfolio faces pressure, I might reduce or close one of the trades before hitting the stop loss. The 30-day correlation between oil and the S&P 500 is 0.83. While I’ve bought two different futures, it’s essentially the same (risk-on) trade.
In my long-term investment account, I sold 50% of my gold on Tuesday, April 22nd, and reinvested the proceeds into the Nasdaq-100, which has paid off so far. My ideal scenario is a short-term equity rally, and continued weakness in gold, allowing me to reverse positions - increasing my gold allocation and reducing Nasdaq-100.
Quick Thoughts on Rates, Oil, and Currencies
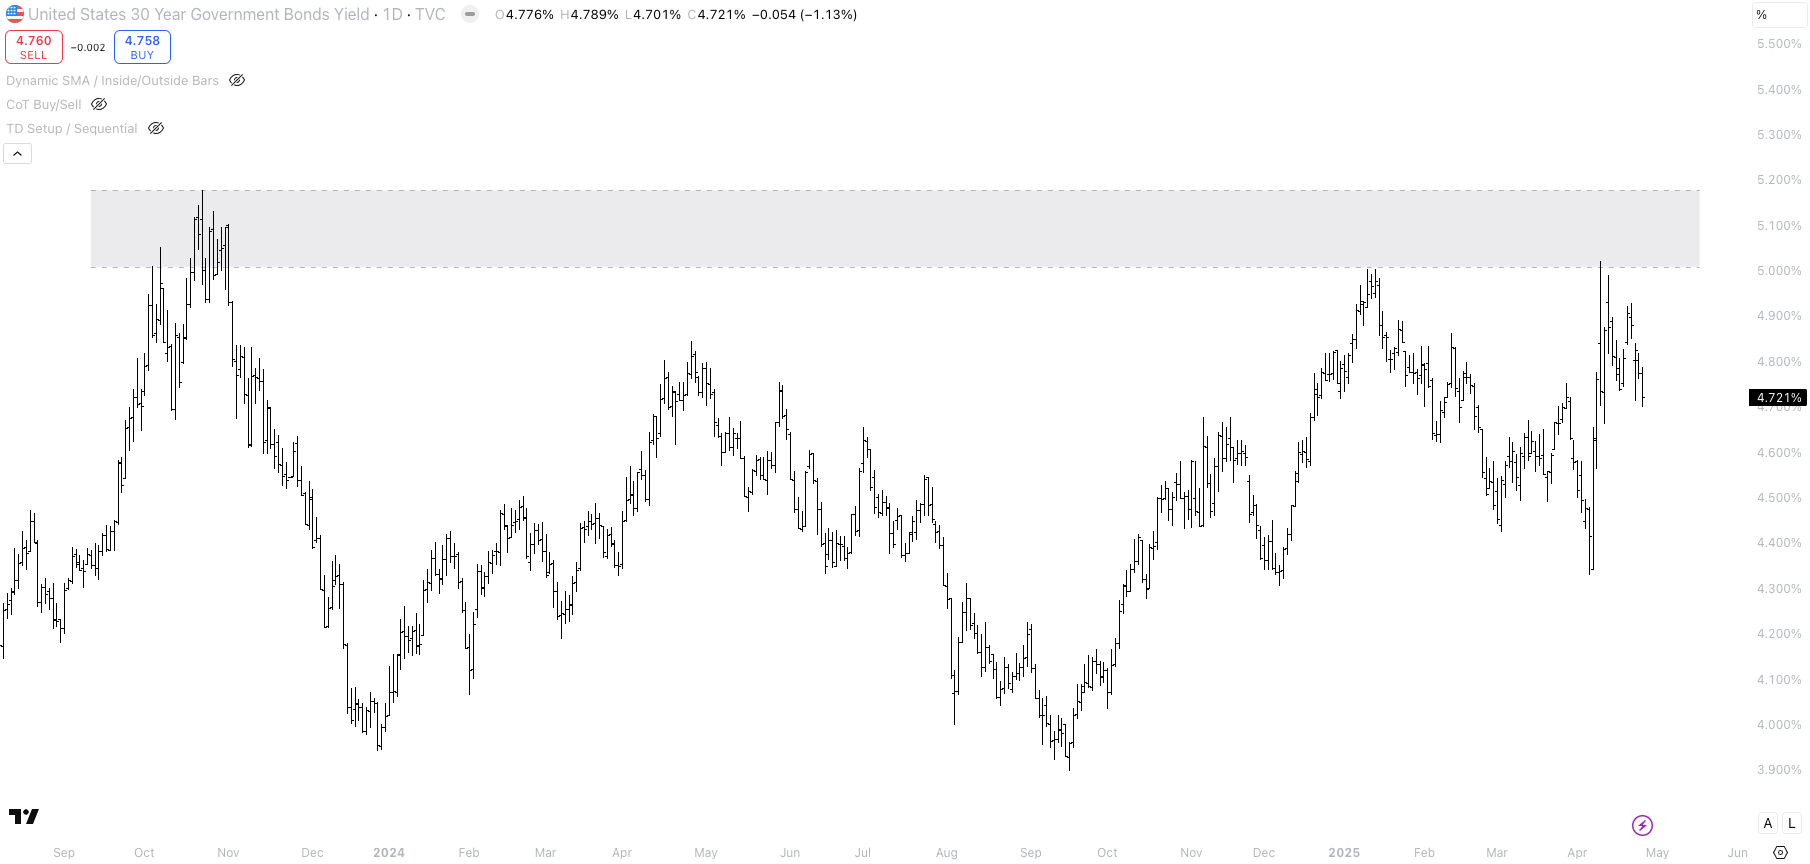
Last week, I highlighted the 5.00%–5.20% range as the danger zone. The key question is whether pension funds, insurers, and asset managers will step in and buy 30-year U.S. bonds yielding 5%. On Wednesday, U.S. 30-year yields actually closed higher after Trump stated he had no intention of firing Powell. Initially, I viewed this as poor price action.
However, in the past two days, U.S. 30-year rates have rallied. Could this be the first sign that confidence in the U.S. is returning? I also believe that the longer the Federal Reserve remains on pause - potentially even in June - the lower 30-year yields will go. After the swap spread unwind earlier this month, I think the market reached peak bearishness. If we see a relief rally, I could see 30-year yields moving towards 4.50%.
The primary risks for 30-year rates are: 1) higher inflation due to tariffs, and 2) term premium expansion from larger coupon auction sizes. Next week, the U.S. Treasury will release net borrowing estimates and coupon auction sizes as part of the Quarterly Refunding Announcement (QRA). It will be interesting to see how 30-year rates react to these numbers.
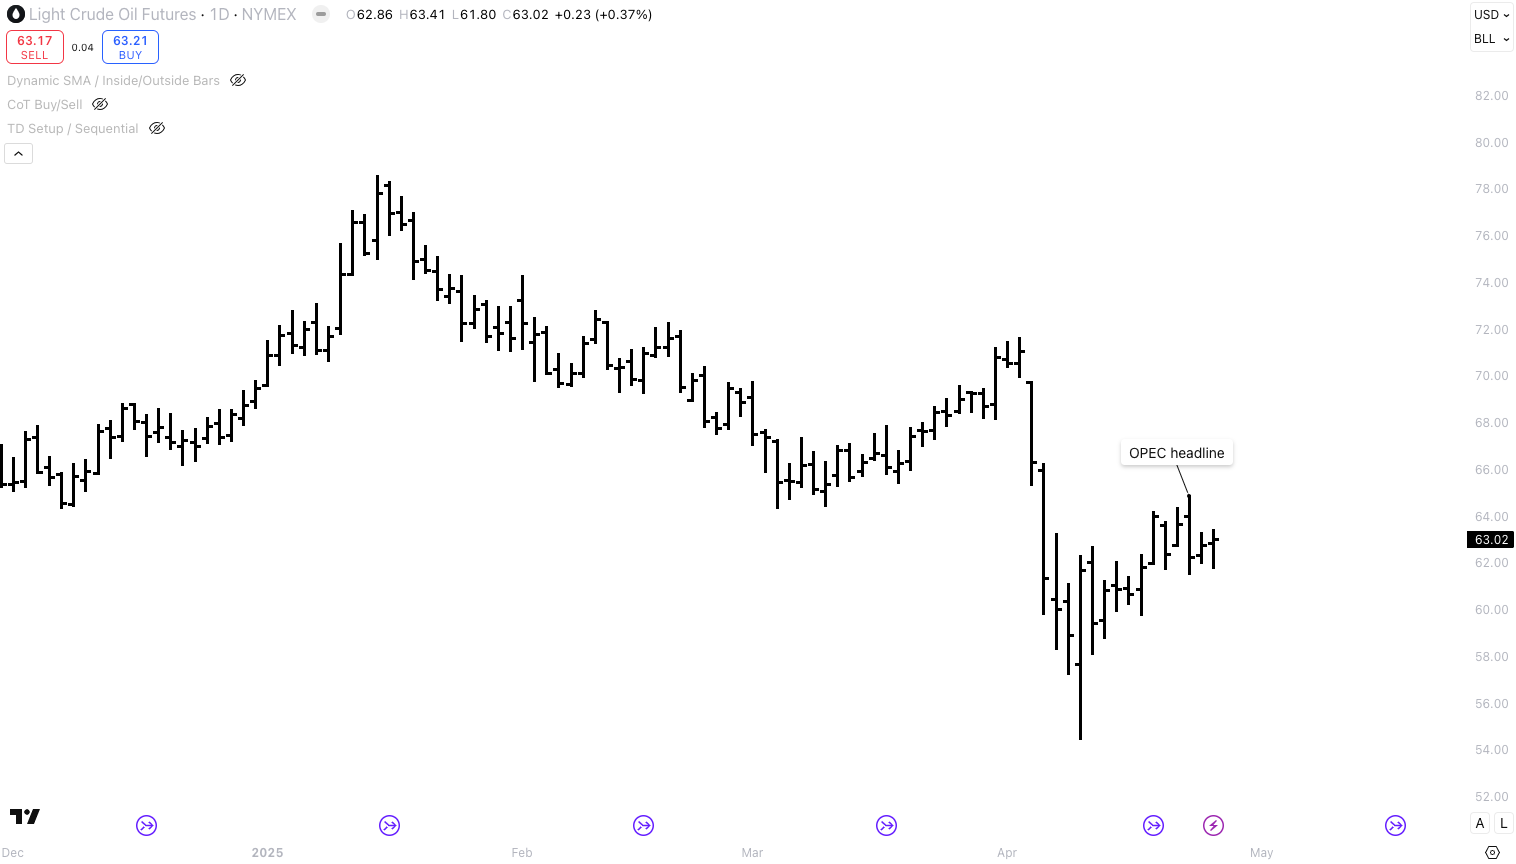
Positioning in crude oil is currently crowded short, and it may be starting to unwind. However, bearish forces still exist that could push oil prices lower. On Wednesday, April 23rd, the headline broke that "several OPEC+ members want the group to approve another accelerated oil output increase for June during their May 5th meeting."
The possibility of another production increase concerns me. Oil sold off 2.2% last Wednesday and has yet to reach new highs. In the equity world, the market is climbing a wall of worry - I hope the same applies in commodities.
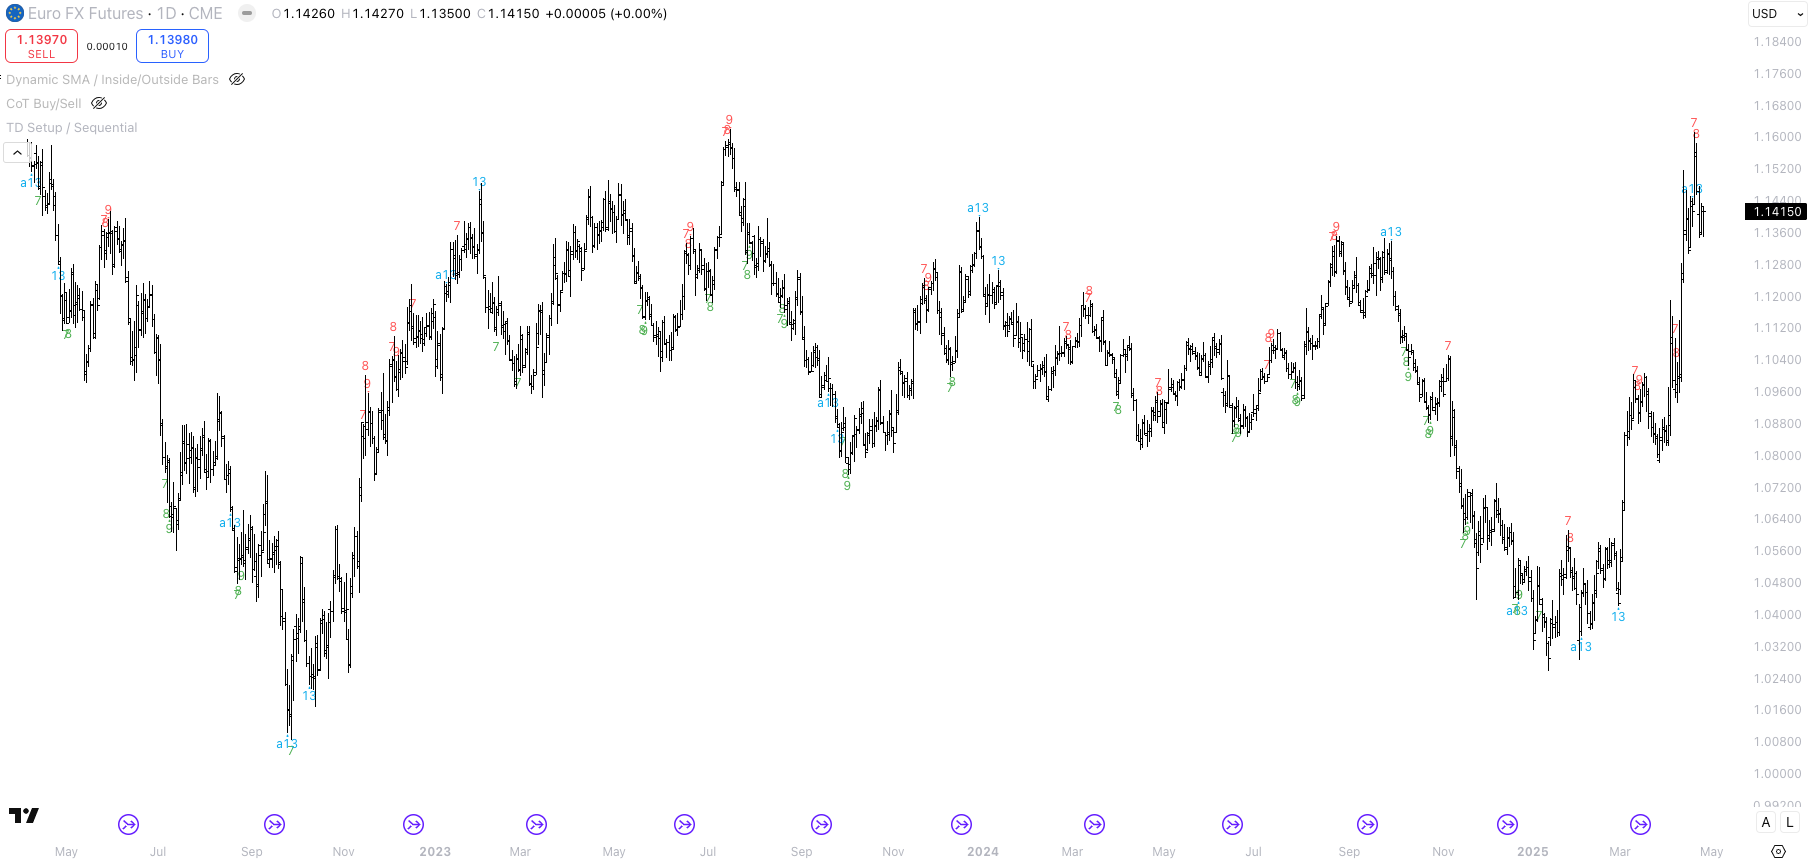
Remember in January, when not a single U.S. dollar bear existed? Fast forward four months, and there isn’t a single U.S. dollar bull to be found. The FX flow story — international investors reallocating into EUR, JPY, etc., to reduce USD exposure — makes sense to me. But trees don’t grow to the sky.
Even if Trump’s policies lead to a multi-year USD bear market, there will still be counter-trend rallies. Right now, I think the Euro is extended. Beyond FX rebalancing, there’s no strong bull case for Europe.
Germany is forecasting 0% growth in 2025, which would mark the first time in its history that the country has experienced three consecutive years of no growth. Demographics remain a challenge, structural reforms are lacking, and deregulation is nowhere to be seen.
The initial EUR bull case was a German stimulus bazooka — but that’s old news. What’s going to drive the Euro higher now? It’s tough to say when FX rebalancing will stop or reverse, but positioning feels increasingly stretched.
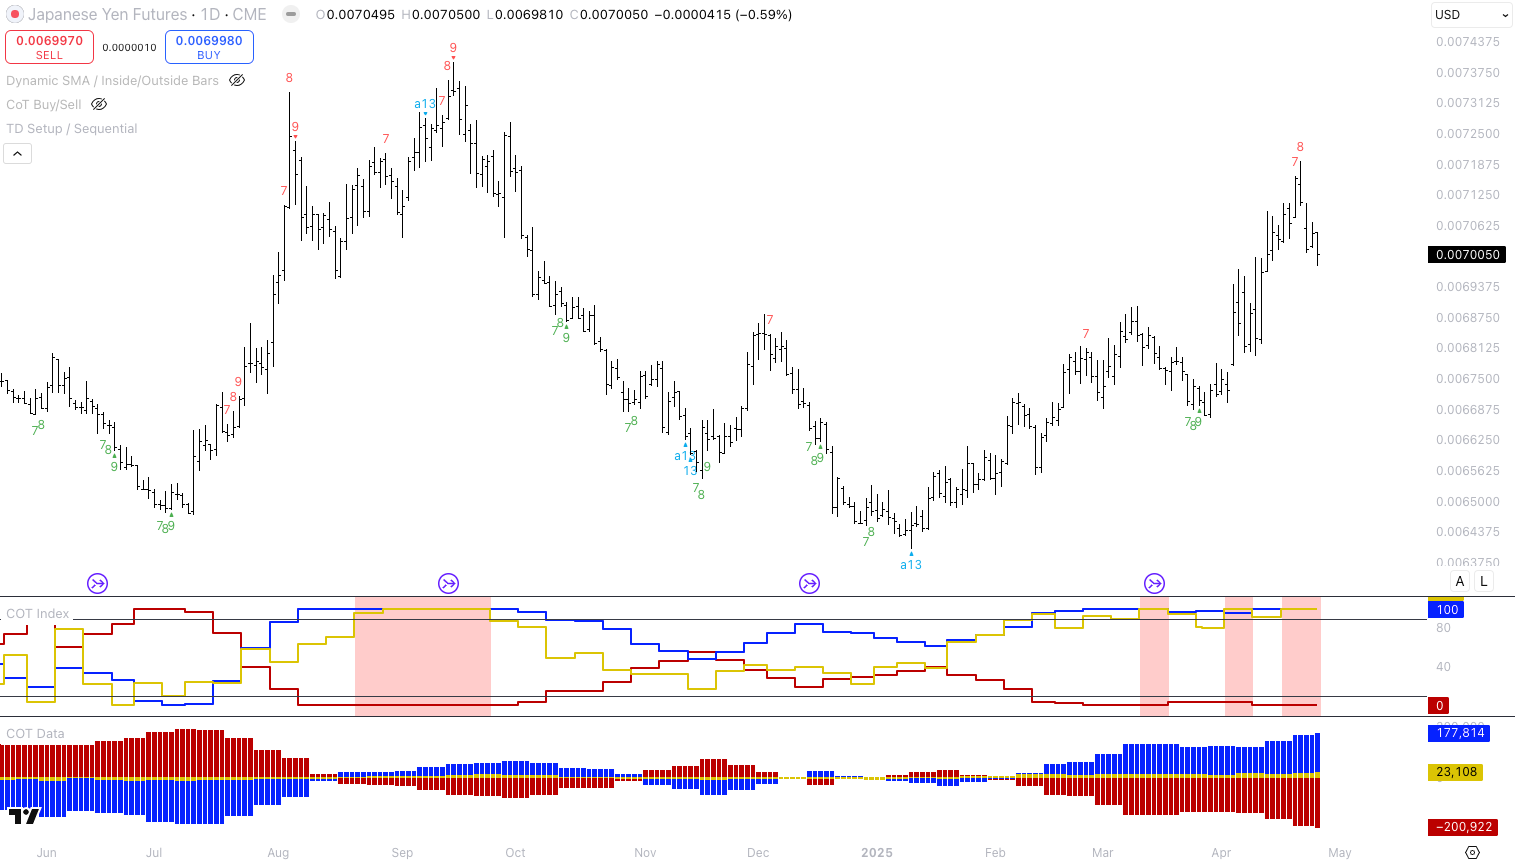
Lastly, macro investors are crowded long JPY, and last week’s price action was concerning. On Friday, Tokyo core CPI came in at 3.4% versus an expected 3.2%. Higher inflation typically signals higher rates, which should support a stronger yen. Yet, Japanese rates barely moved, and the JPY sold off.
Right now, I think the risk-to-reward for shorting JPY is favorable. However, I’m not executing the trade myself because JPY’s 30-day correlation with the S&P 500 is -0.63 and with crude oil, it’s -0.75. Essentially, shorting JPY is a similar bet to going long the S&P 500 or crude oil.
I hope you enjoyed this article. This is not investment advise and all views are my own. I write these articles because they help me to stay disciplined and transform my thoughts into actionable trade ideas. I always appreciate your feedback, likes and comments!
Dear Mr. Repo,
Thank you for once again sharing a great piece.
I read your article exactly one week after publishing, so, with the benefit of hindsight on my end, I have to say: spot on!
Truly great takes here, specially on the equity side. The market always has a way of going towards the max pain, right? It is truly amazing.
I think you are also very brave in calling out the lack of drivers for EUR rally, and last week's price action clearly aligns with your view, momentum is slowing and "the end of the USD" seems to be taking a breath. Could flows persist against the greenback? Maybe, I don't know. Maybe there's a secular decline that brings the USD lower, which I wouldn't necessary say its a bad thing for the US economy. But on a shorter term, it seems to be exhausted and you called it.
Regarding oil, although SPX and WTI have been correlated as you point out, last week's correlation seem to drop, with stocks rallying and oil tanking further. Opec announced yesterday to extra 411k bpd coming in June, I'll be sure to check price action tonight/tomorrow to see if there's a news failure and oil doesn't go much lower than this, any thoughts?
Also, though I know you don't normally trade in relative value, wouldn't you think that Oil and SPX seem to be pricing a divergent economic landscape? I get lower oil could reflexively push stocks higher as there's less inflation, higher real wages and stronger economic conditions, but that should also, in turn, push oil higher. Haven't done proper math on it, but it seems to be that SPX/USO is overbought technically and, fundamentally, I can't reconcile both price actions; if SPX is correct about economic strength, Oil should get a bid close to this level, IMHO.
Would love your thoughts here.
Thanks once more for sharing your knowledge and thoughts, it is greatly appreciated.
Best,
Valentino