
The Pain Trade in Equities, Risk-On Setups, and the Long-End
Trump's 10% baseline tariff will result in slowing economic growth. But the pain trade in equities is higher. And more thoughts on the long-end, crude oil, and JPY.

This article is structured in two parts: first, I briefly lay out my current economic outlook, followed by a detailed breakdown of my views across financial markets—from rates and equities to FX and commodities.
These write-ups take a lot of time and effort to put together, so if you find them helpful, I’d really appreciate it if you shared them, forwarded them to a friend, or posted them on X. It keeps me motivated to keep doing the work and putting these pieces out regularly. Having said that, let’s dive right in!
Trump’s Tariffs Are Still Bad for Economic Growth
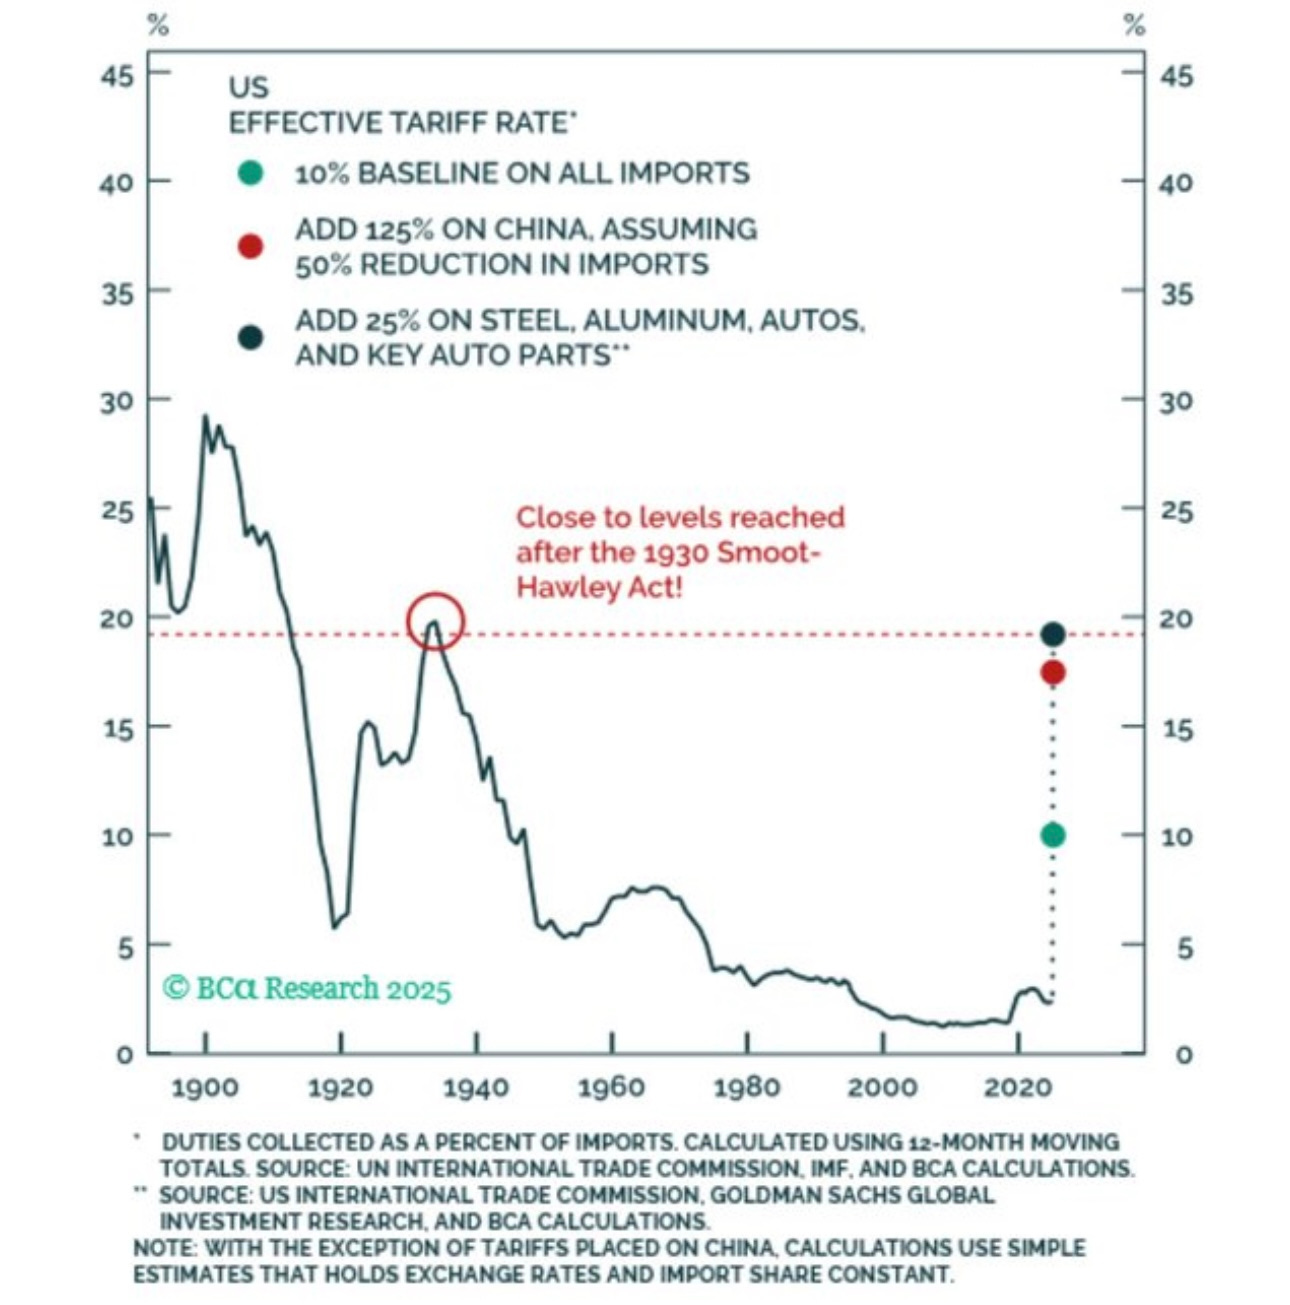
Last week, the White House announced that more than 70 countries had reached out to the United States to negotiate trade deals. Whether prompted by the recent rise in US 30-year yields above 5%, or by countries seeking to reduce tariff rates and trade barriers, Trump responded by announcing that - with the exception of China - all tariff rates will be set at 10% for the next 90 days.
The announcement was well-received by equity markets, with the S&P 500 rallying 9.5% on Wednesday. Markets welcomed the clarity, and if there’s one thing equities dislike, it’s uncertainty. This weekend, the Trump administration announced that certain electronic products such as computers, smartphones and chip-making equipment will be excluded from reciprocal tariffs. Meanwhile, China’s tariff rate was hiked to 145%. In response, the Chinese government retaliated by raising tariffs on US goods imports to 125%.
Despite the market reaction, these tariffs are expected to drag on growth - likely shaving 0.5% to 0.75% off US GDP. The current structure takes the effective tariff rate back to levels last seen in 1930.
Other headwinds include retaliatory tariffs on US exports (0.2%–0.3%), tighter immigration policies (0.5%–1%), and fiscal tightening measures such as spending cuts and DOGE-related constraints (0.5%–1%). Taken together, these factors suggest further deceleration in GDP growth. This doesn’t even factor in the potential wealth effect. The decline in equity markets will likely weigh on household consumption.
Nominal GDP growth is currently running at 5.0%. If growth slows by 2% while inflation remains stable, the US could slip into a recession. A recession in the United States is not a certainty, but it certainly is a possible scenario.
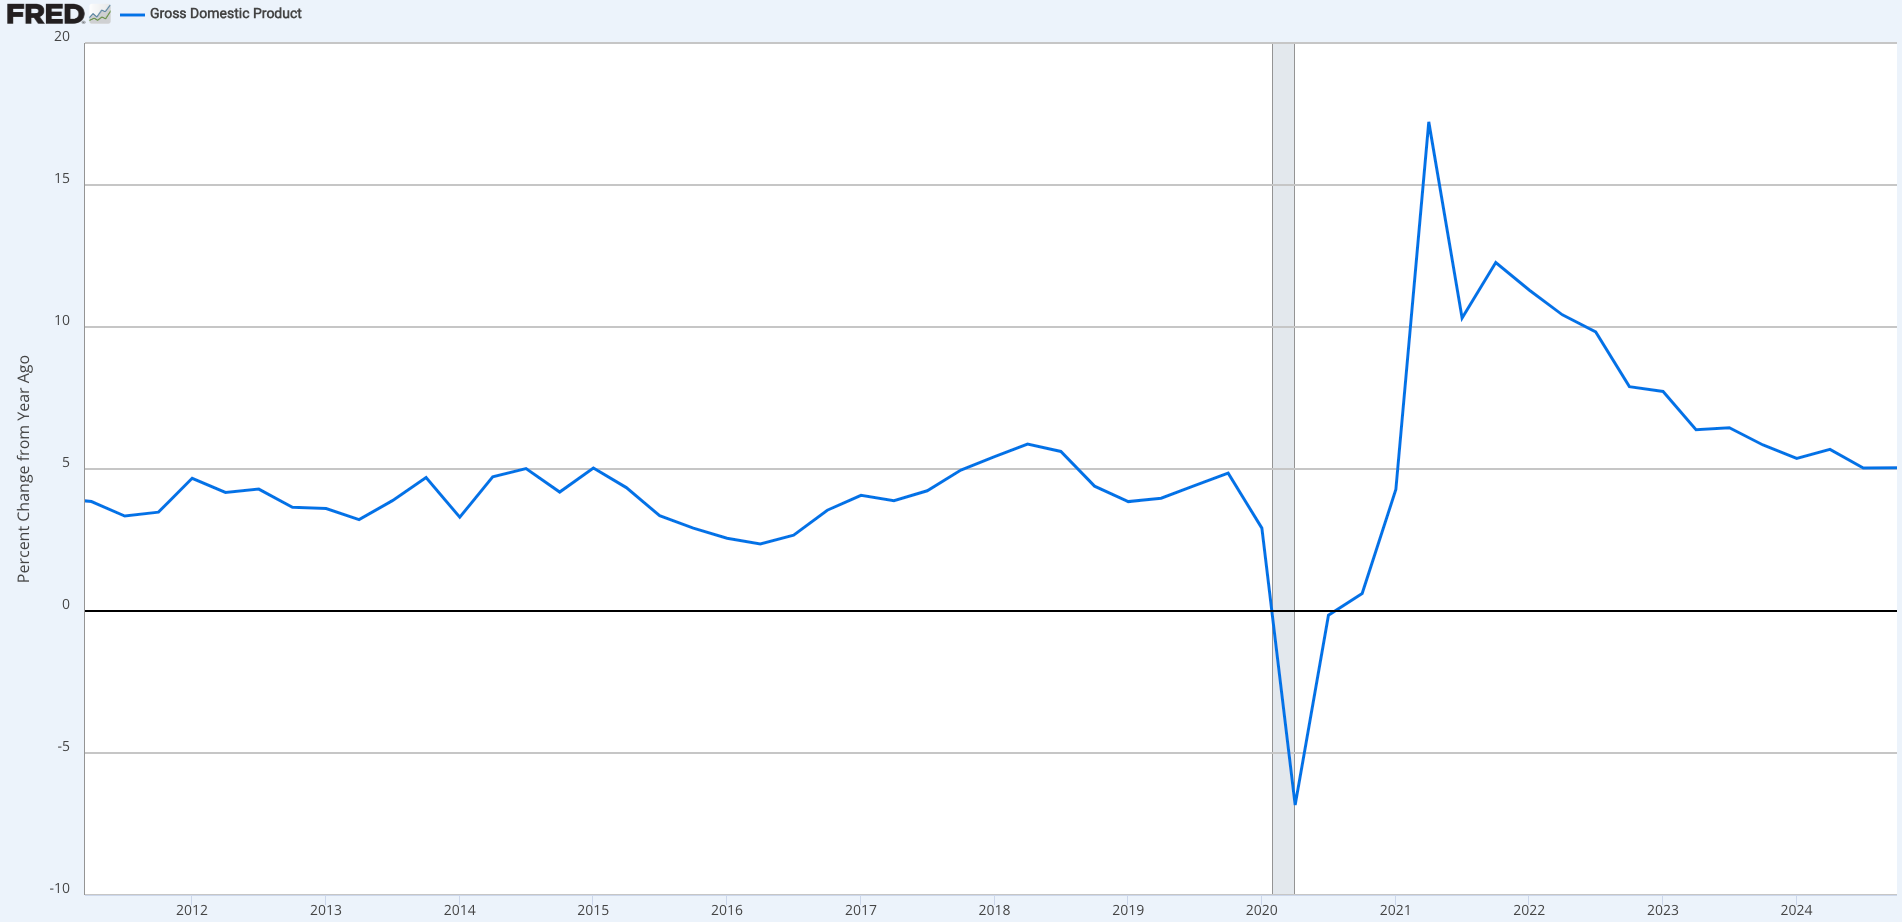
Source: FRED
Inflation: A Much Better Report Than Expected
Thursday’s CPI report came in well below expectations. Core CPI slowed to 2.8% (vs. 3.0% expected), and headline CPI fell to 2.4% (vs. 2.5% expected). More notably, sticky inflation - core services ex-housing - posted a -0.24% m/m reading, the lowest since May 2020.
Shelter inflation, a category known to lag by over a year, has been propping up core CPI in recent months. In this latest report, however, shelter inflation dropped below 4% for the first time. Excluding shelter, CPI is now running at just 1.5% YoY.
It wasn’t just services inflation that surprised to the downside. Core goods inflation - which many investors expected to rebound from depressed levels - also came in soft at -0.09% m/m. That said, it’s important to note that these figures do not yet reflect the potential impact of tariffs.
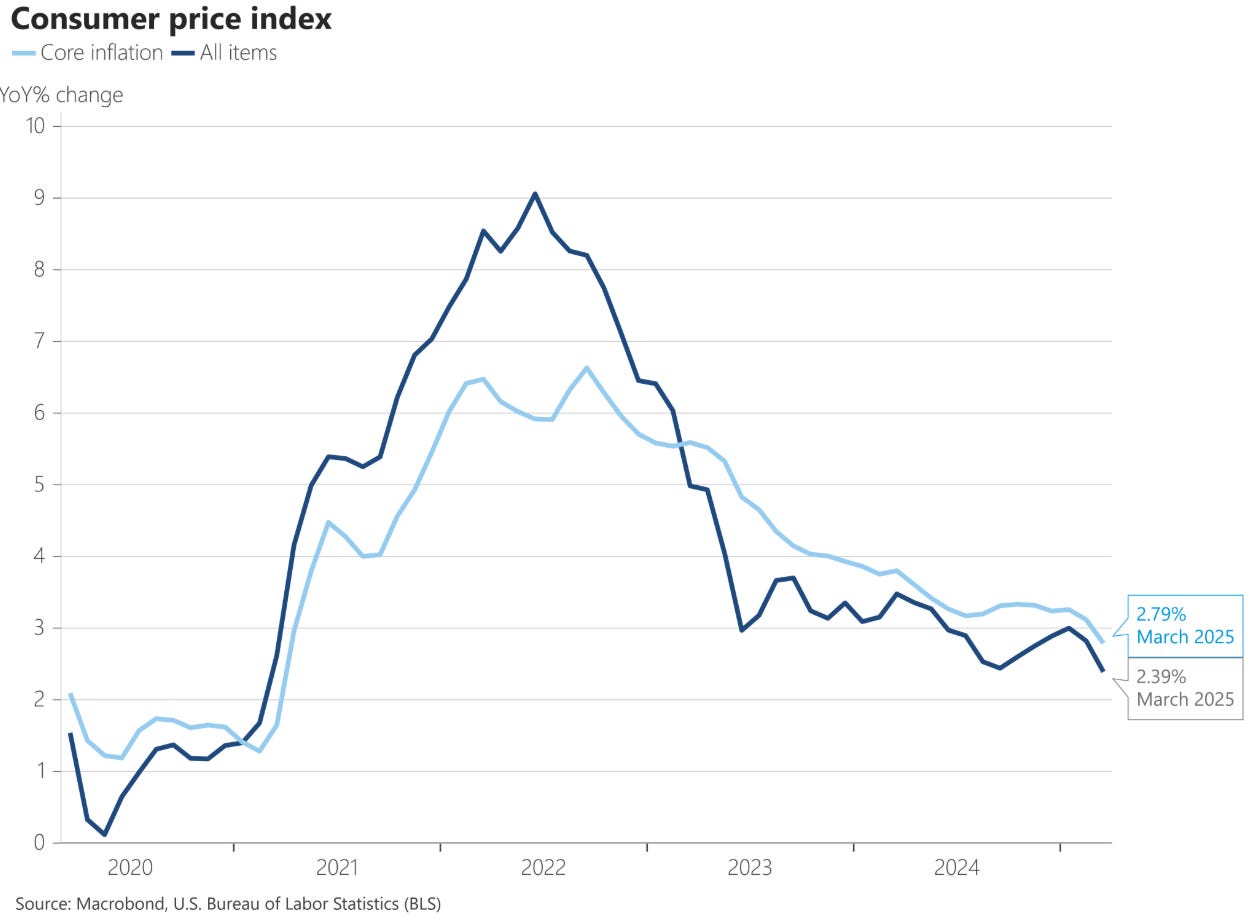
Source: Nick Timiraos on X
Is It Time to Buy the Long End?
Last week, I wrote:
“The risk-reward to go long US 10y is not great. You would be betting on complete economic carnage and a recession.”
Fast forward one week: the US 10-year yield surged from 4.0% to 4.50% - a massive 50bps move. That changes quite a lot. Suddenly, the risk-reward for going long US bonds looks much more attractive.
I’m still unsure whether the US will tip into a recession, but I do expect the economy to cool. This week’s inflation data came in below expectations. While Friday’s University of Michigan inflation expectations surprised to the upside, survey-based data has proven unreliable in recent months. I wouldn’t ignore it - but right now, I’m putting more weight on the softer-than-expected CPI and PPI prints.
30-year real yields are now at their highest levels in decades: 2.68%. Nominal 30-year yields are at 4.88%. For large asset allocators like pension funds, long-end yields near 5% (nominal) and nearly 2.7% (real) offer compelling returns. Layer in the current economic uncertainty - and the increasing probability of a recession - and long-duration US Treasuries become even more appealing.
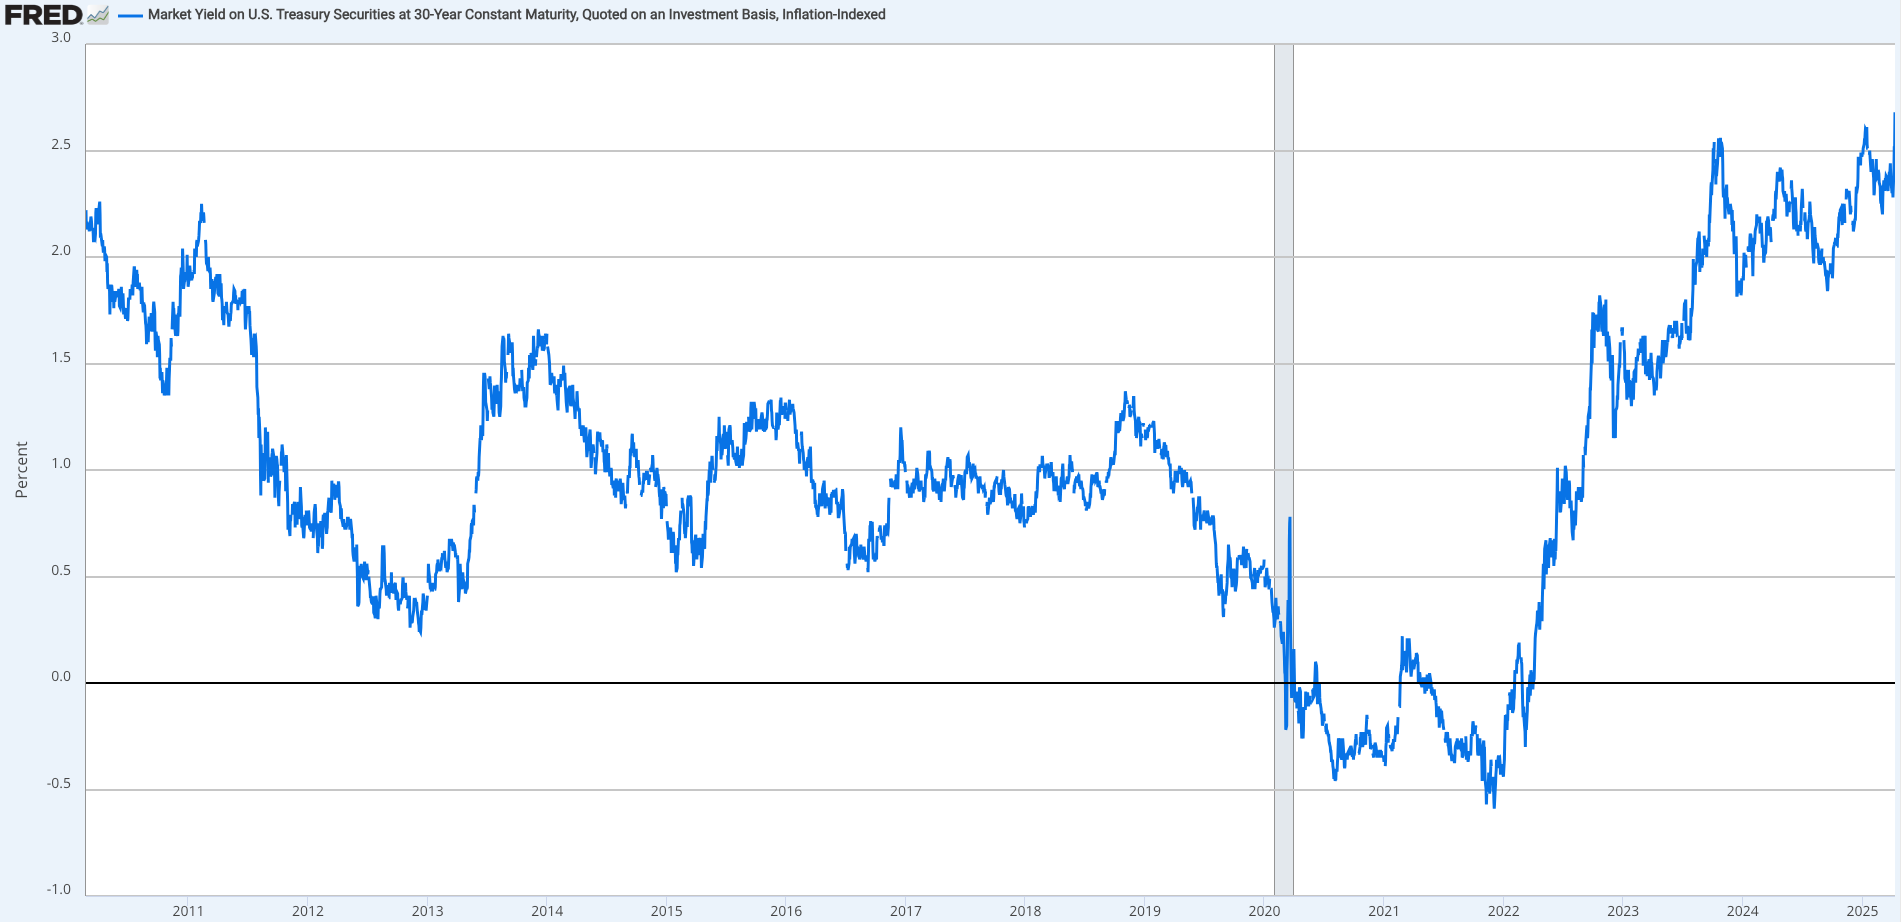
Source: FRED
Beyond the macro setup, I also think dislocations in bond markets are creating opportunities. We’ve seen aggressive swap spread widening over the past few weeks, and the most likely explanation is positioning: banks and hedge funds unwinding large swap spread trades.
After Powell suggested a potential easing of the SLR requirement, many investors likely positioned for increased UST demand - buying Treasuries and paying in swaps. The logic: easier SLR rules would tighten spreads. If that trade is now being unwound, it could explain recent UST selling.
There’s more. If hedge funds involved in futures-bond basis trades are being forced to post (more) variation margin - because futures are selling off more rapidly than bonds in cash, or due to heightened volatility - that could lead to more UST selling. Multi-strat funds deleveraging and offloading liquid assets like Treasuries could also be contributing to the selloff and wider swap spreads.
Interestingly, ZB (US 30-year futures) stabilized on Friday and even caught a bid later in the day.
“Bond vigilantes are back” is a phrase I’ve seen multiple times over the past week. The implication is a broad US asset selloff: equities down, bonds down, and the US dollar down. To me, it feels like parts of the market are starting to panic.
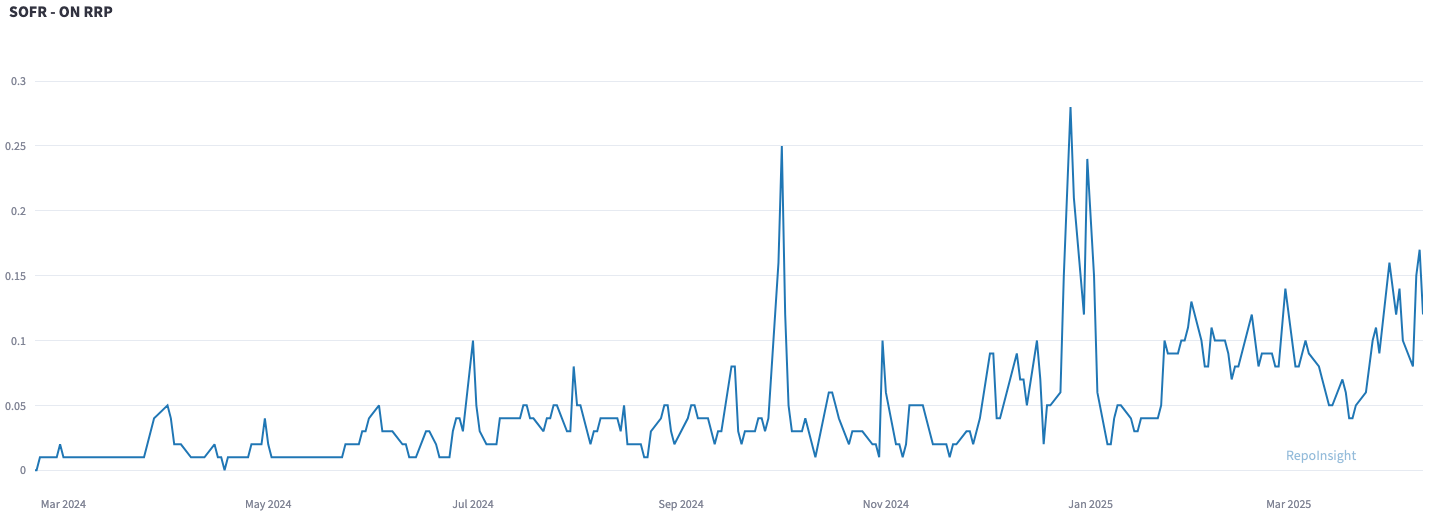
Beyond the concerns around Trump’s policies, we’re also seeing rising anxiety about potential funding stress in US repo markets. It’s true that volatility in money market rates has picked up - evident in the widening spread between SOFR and the RRP.
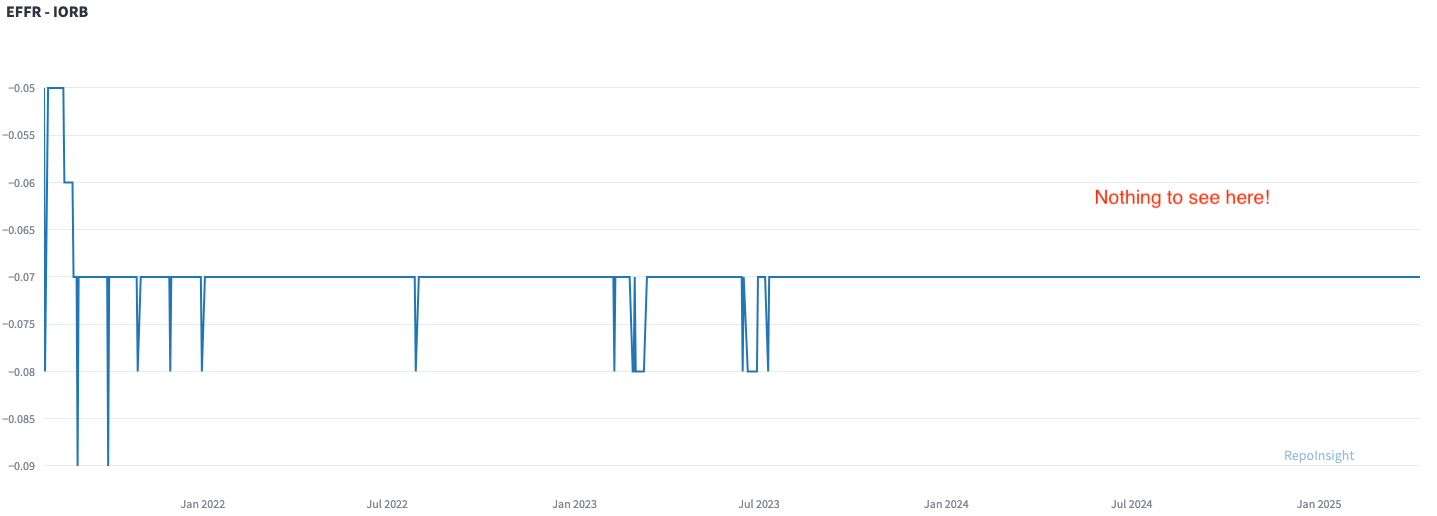
But context matters. Reserves as a percentage of banks’ total assets remain ample at 14%. For reference, when repo market stress emerged back in September 2019, this figure had fallen below 8%. If liquidity stress were truly brewing in the interbank market, we’d expect to see more unsecured funding activity by banks - reflected in a rising Effective Fed Funds Rate (EFFR) versus the Interest on Reserve Balances (IORB). So far, that divergence hasn’t materialized.
The Fed’s own Reserve Demand Elasticity Model (RDE) also shows no signs of stress in the interbank market. The RDE shows by how many basis points the spread between the EFFR and IORB would move for an increase in aggregate reserves equal to 1 percent of banks’ total assets. If the value is close to zero, reserves are not scarce.
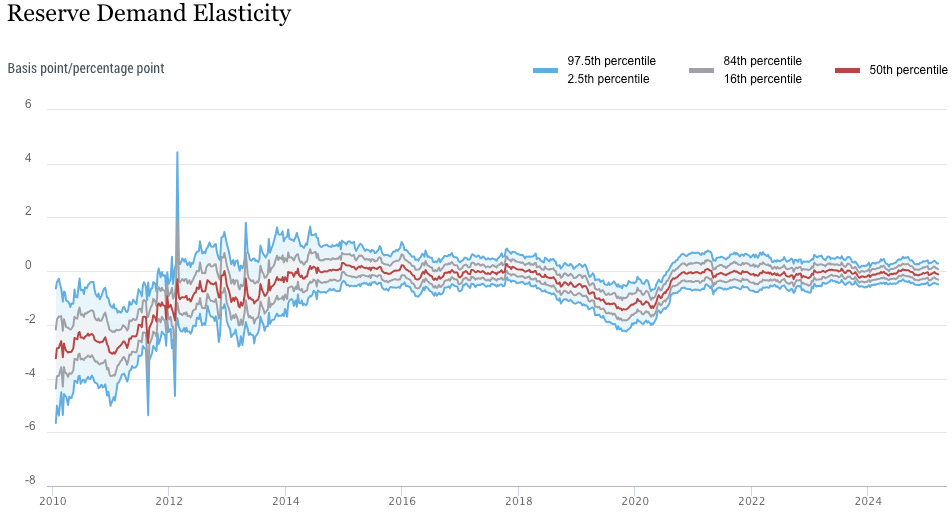
Source: New York Fed
In my view, the spike in SOFR vs. RRP is more a reflection of excessive leverage in the system than a true liquidity crunch. If there is stress, it’s likely related to the limited intermediation capacity of dealers. When highly leveraged positions - like basis trades or swap spread bets (often >50x levered) - unwind simultaneously, they can drive repo rate volatility. This only becomes a systemic issue if it happens too quickly.
For now, reserve levels remain healthy, and I see no reason to panic. Friday’s market action suggests a return to calm as well: 30-year swap spreads tightened from -96 to -89bps (+7bps). I also believe the Fed is acutely aware of the risks that the bond basis trade poses to financial stability. And if needed, the Fed would step in (headline from Friday):
FEDERAL RESERVE 'ABSOLUTELY' READY TO HELP STABILIZE MARKET IF NEEDED, TOP OFFICIAL SAYS – FT
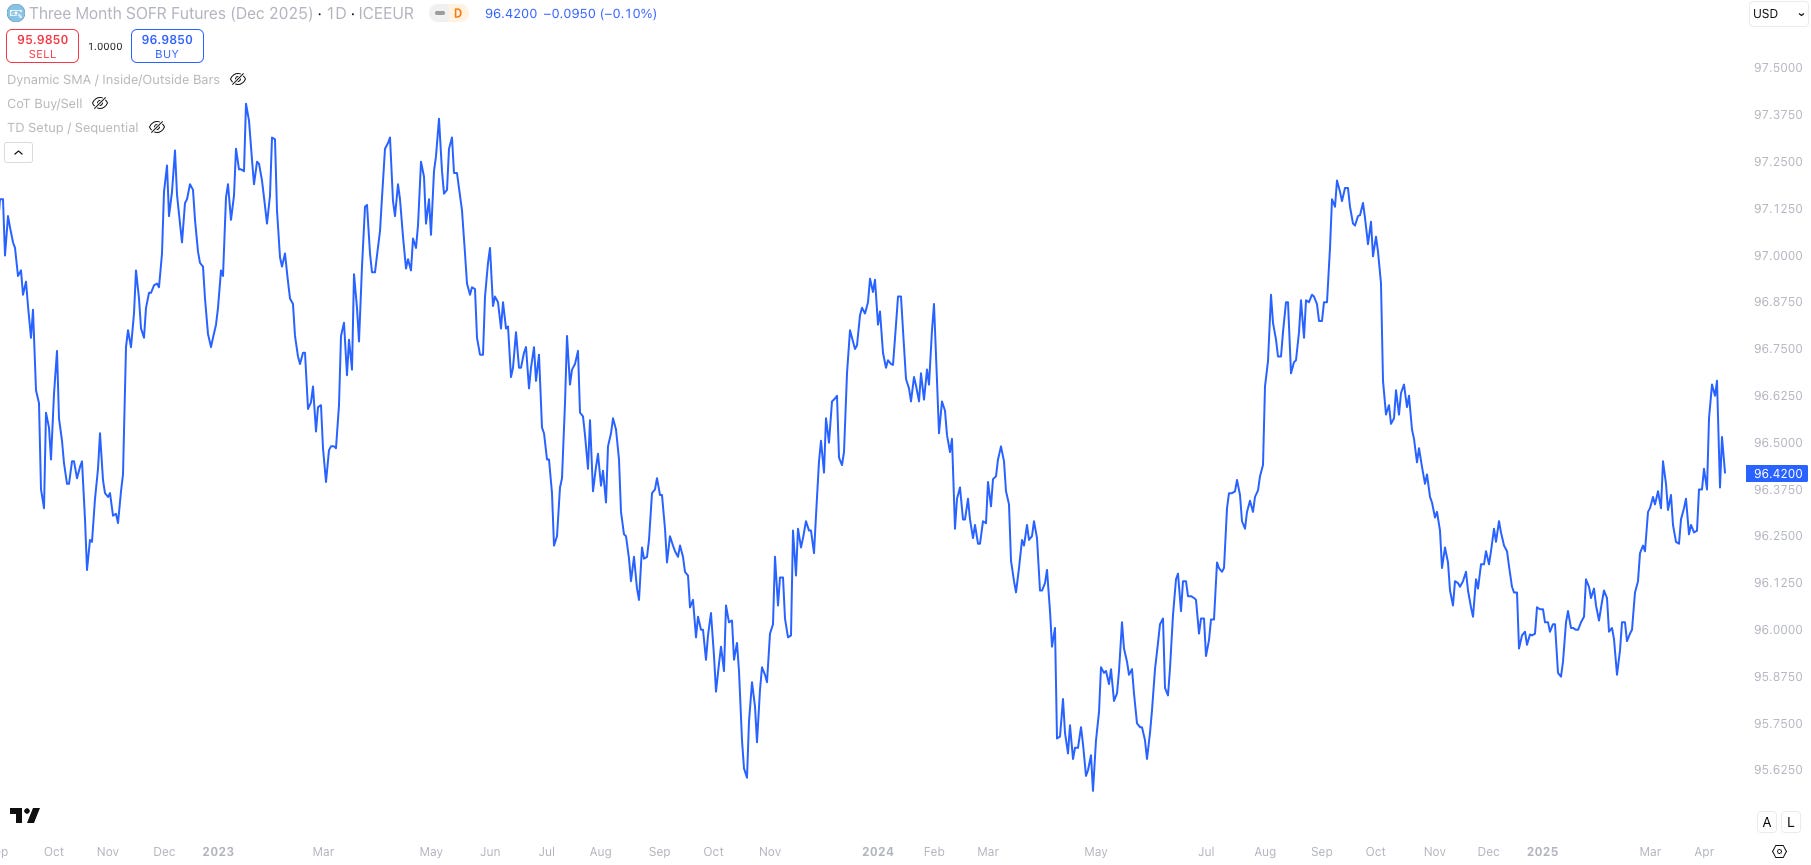
Now, a quick note on the short-end. Last week, I wrote that SOFR December 2025 futures were a short at 96.93, as the market was pricing in four rate cuts for 2025. This week’s bond market selloff led to a repricing: now just three cuts are priced in. That’s not extreme, in my view. SOFR December 2025 futures are trading at 96.42, and at these levels, I’m back to neutral.
Equities - The Pain Trade is Higher
Sentiment remains bearish, whether you look at AAII’s investor sentiment survey or the Fear & Greed Index. Equity indices are still sitting at oversold levels, as measured by metrics like the percentage of S&P 500 stocks below their 50-day moving average or the number of S&P 500 stocks with RSI readings below 25.
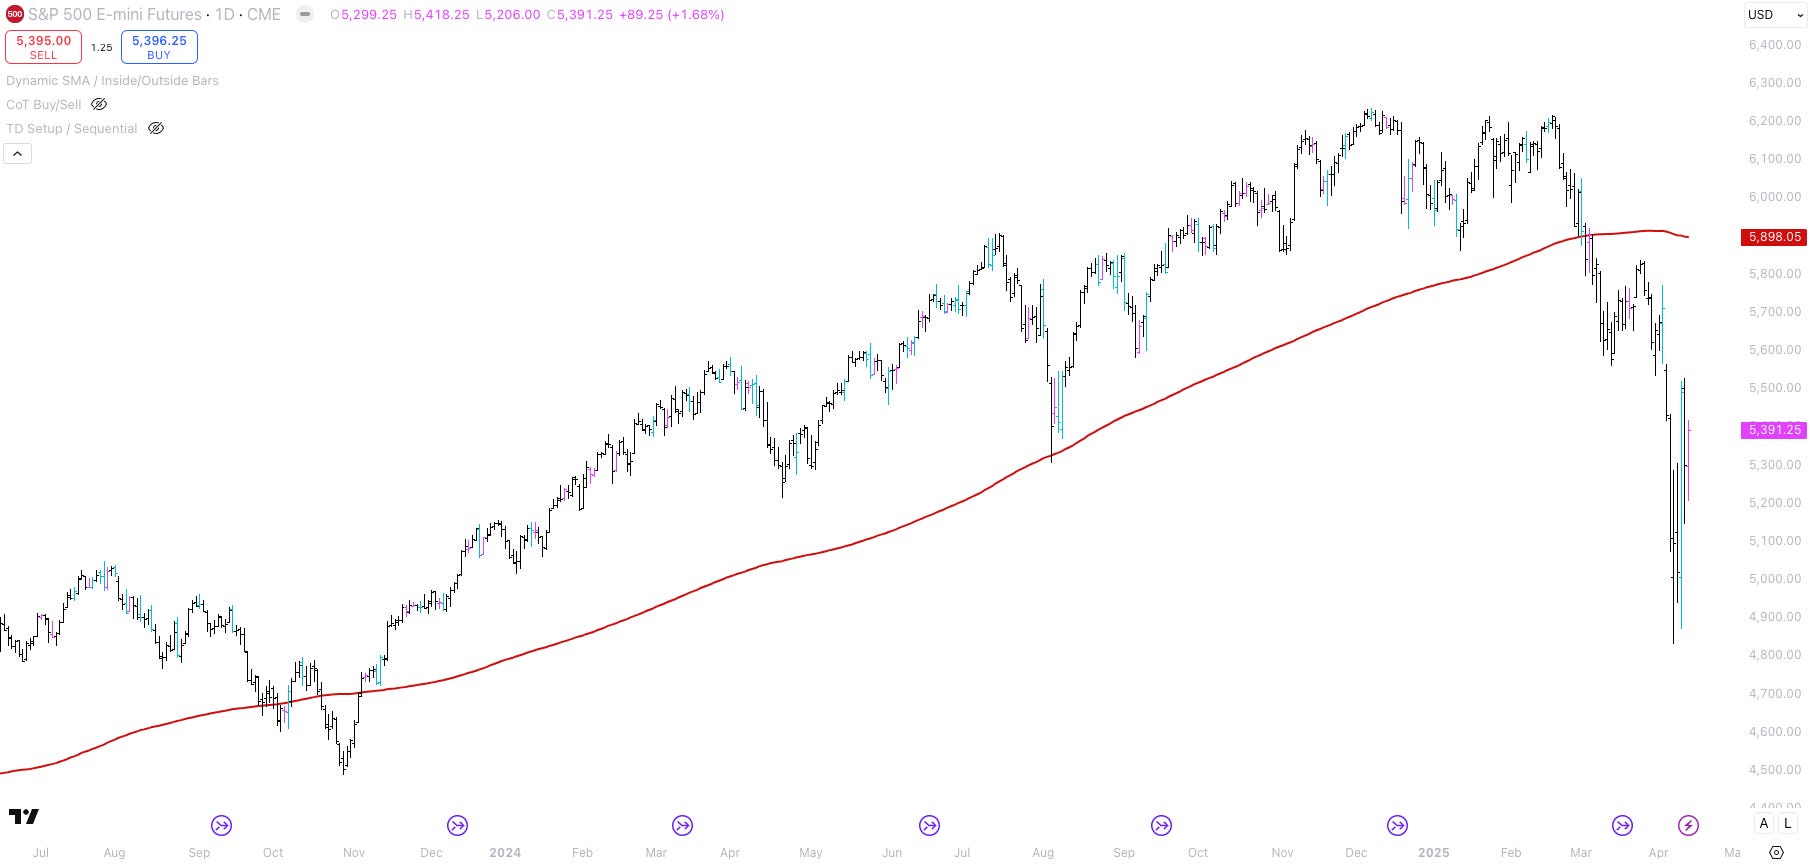
With parts of the market panicking - claiming US exceptionalism is dead and the “bond vigilantes” are back - I think the pain trade is higher. In other words, the path of maximum frustration may be a rally in the S&P 500 from here.
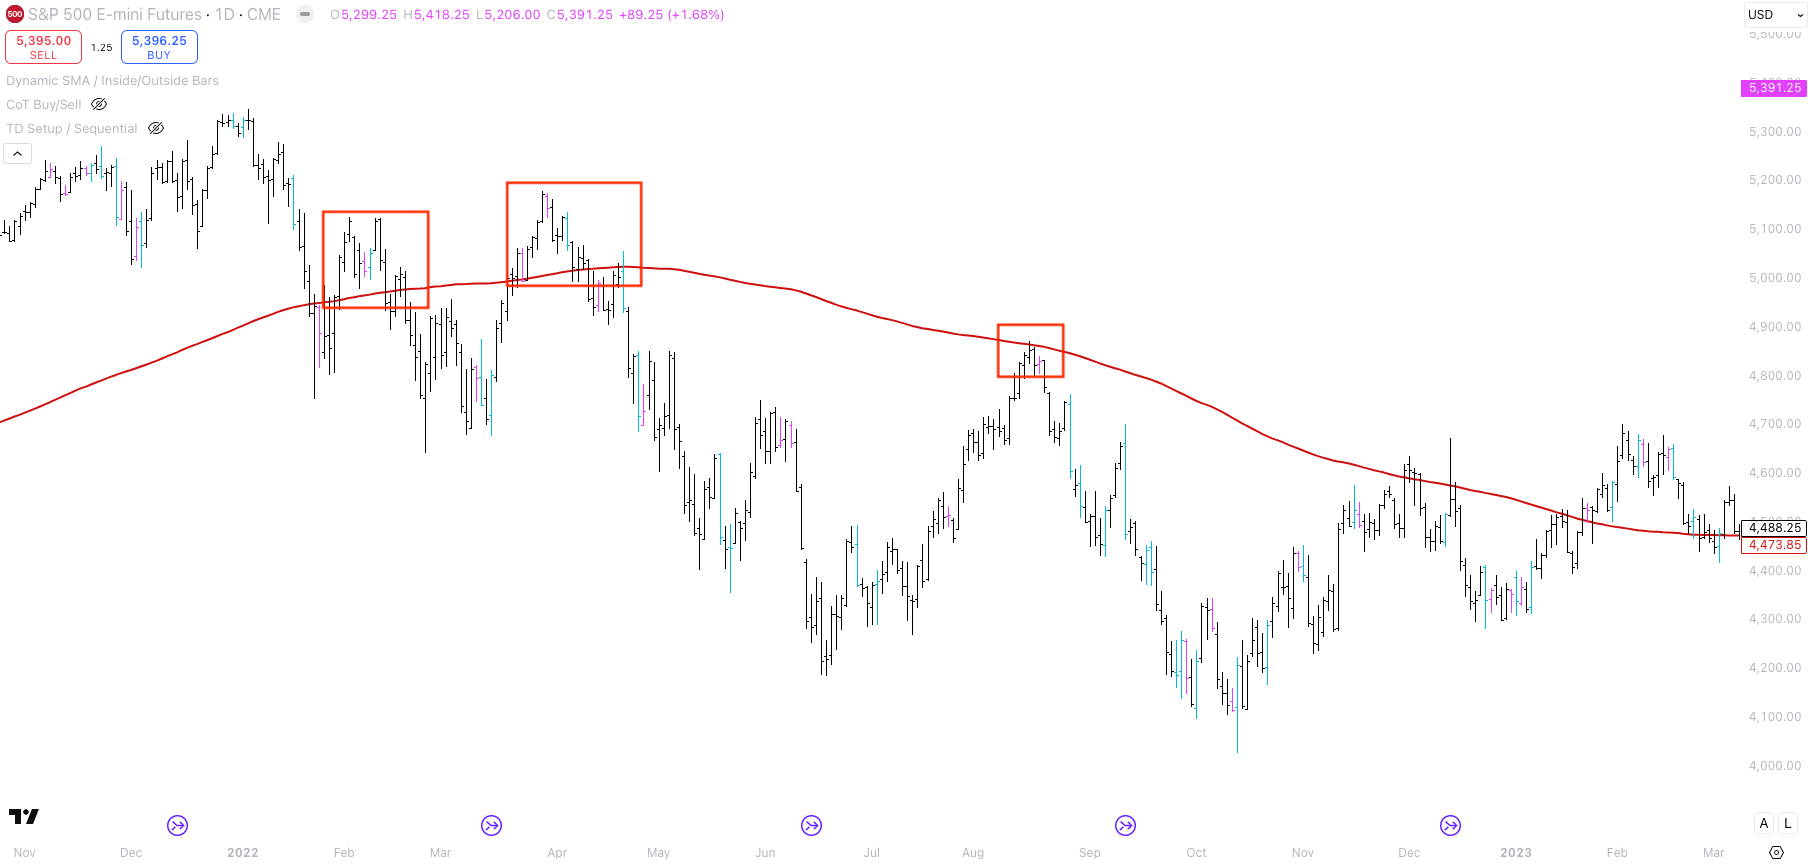
A move toward the 200-day moving average, or even a break above it, is not unusual in multi-month bear markets. Just look back at 2022 - we saw several of those.
If it takes several months to finalize new trade deals - which seems likely - a 10% baseline tariff on most US goods imports will remain a drag on the economy throughout 2025. Under that scenario, it could take time before the S&P 500 makes a sustained move to new all-time highs.
If the market rallies back toward the 200-day moving average (~5,800 on the S&P 500) but incoming economic data points to a slowdown, we could see another leg lower - similar to the pattern we saw in 2022.
Despite the selloff, earnings expectations and valuations remain elevated. As I noted last week:
“If forward EPS falls to $265 (from $279) and forward P/Es compress to 17x (2022 lows: 16x), the S&P 500 would bottom around 4,500.”
At the same time, bond yields - particularly long-term real yields - are elevated, which makes equities less attractive on a relative basis. If Trump’s policies trigger a growth slowdown in 2025, investors counting on >10% EPS growth could find themselves caught offside.
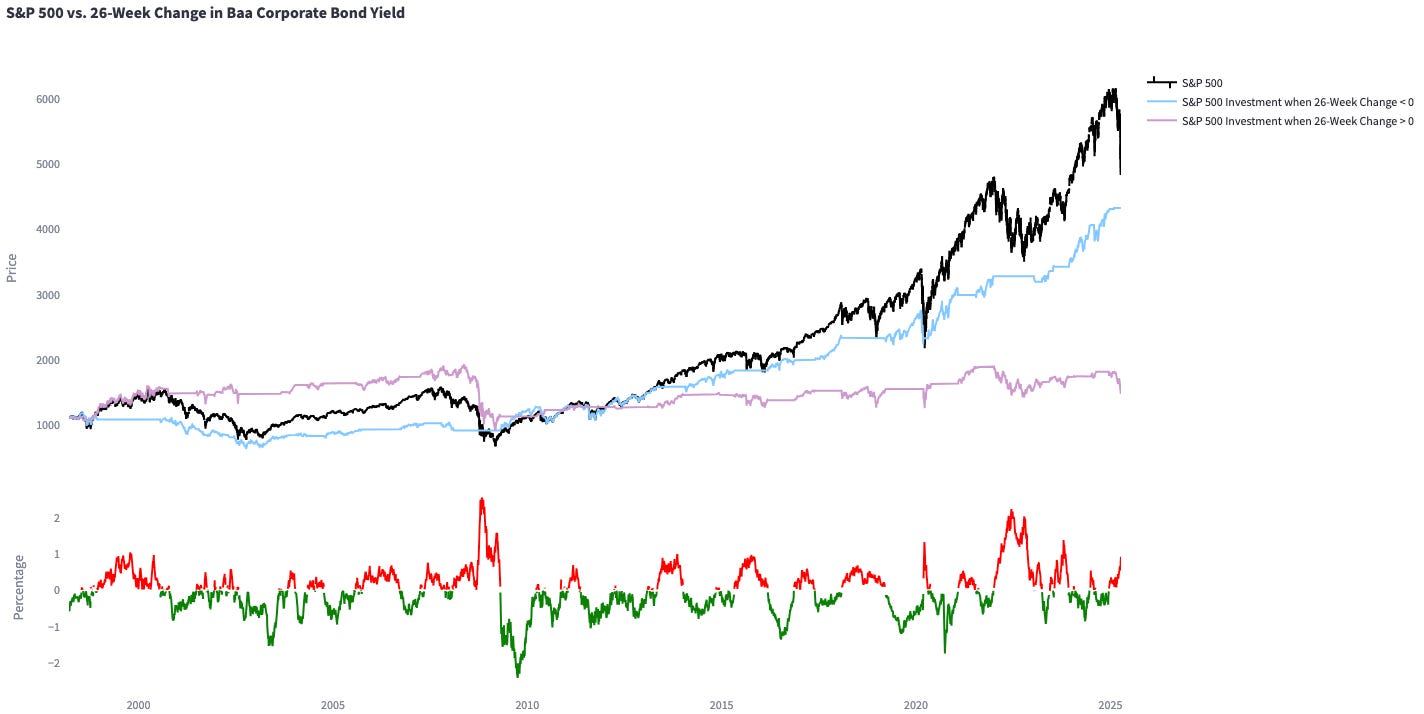
We’re also in an environment of rising corporate bond yields, a backdrop that has historically been unfavorable for equities.
To summarise, I think the pain trade in equities is higher near-term. I don’t expect the negative news flow around tariffs to persist at the current pace. However, over a three to six month horizon, equities still don’t look attractive to me - despite the recent selloff. But keep in mind, with the Trump administration releasing major market-moving headlines almost daily, this outlook could shift in the months ahead.
Thoughts on Positioning in Oil and JPY
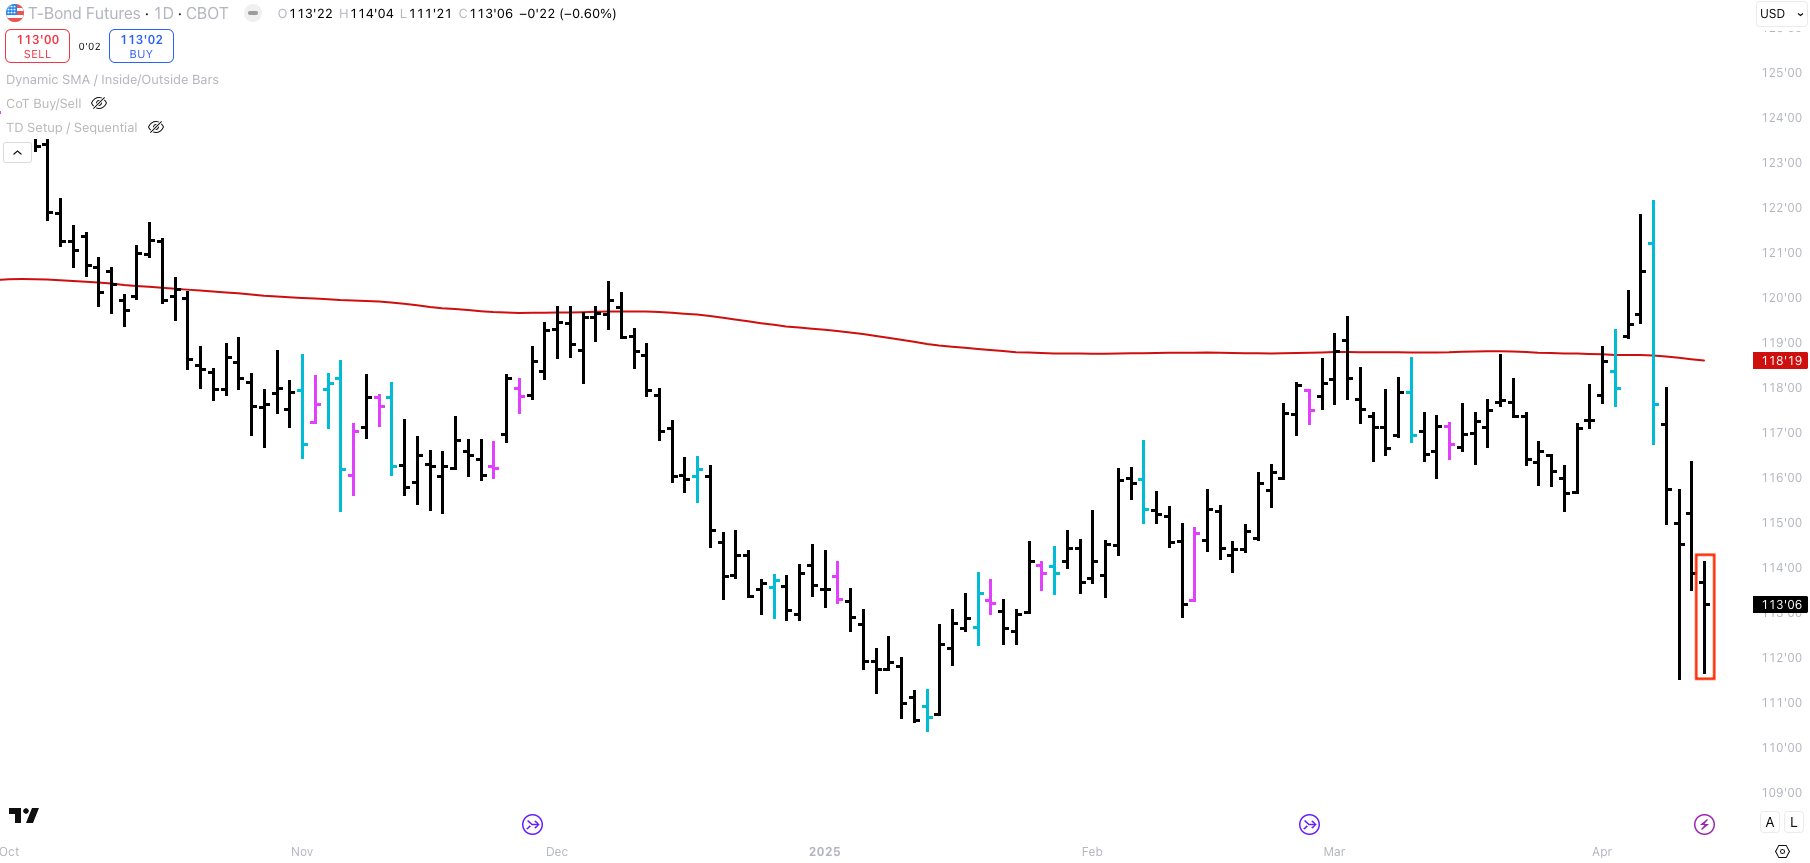
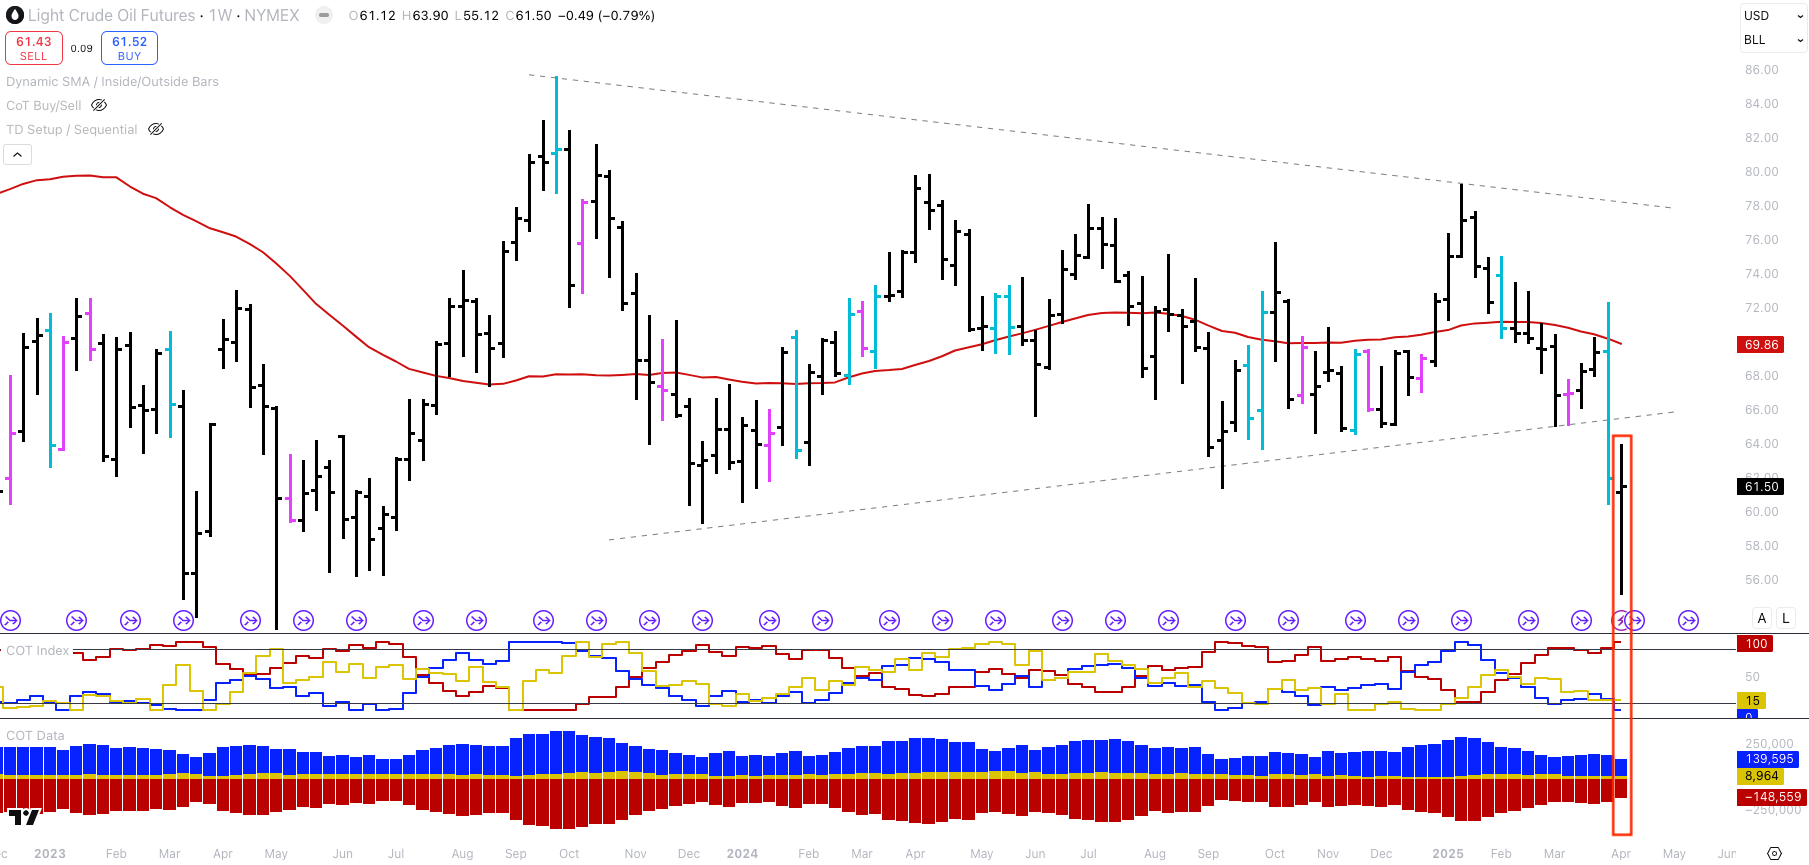
Crude oil has sold off sharply over the past two weeks, briefly dipping as low as $55.12. Positioning now looks crowded to the short side. Instead of trading the pain trade in equities, one could also express a risk-on view through crude - betting on a bounce off the lows. The weekly oil chart below suggests that the downside may be stretched.
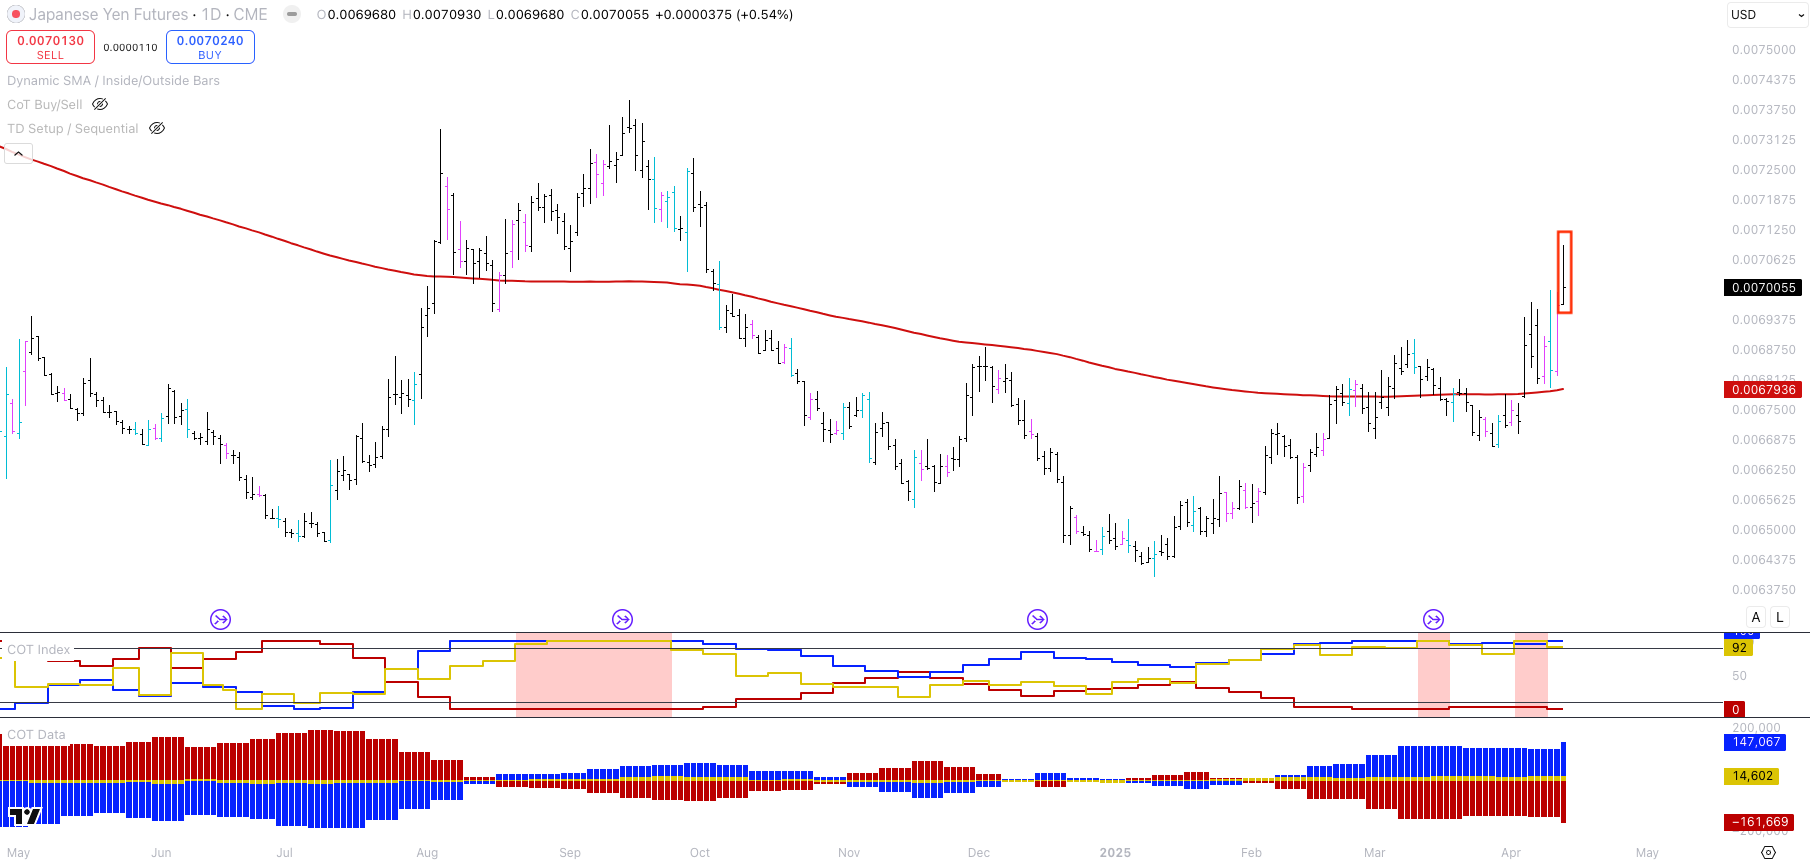
Alternatively, you could express a risk-on view by shorting JPY. Positioning still looks crowded to the long side, and long JPY remains one of the most consensus macro trades out there. It’s worked over the past two weeks, but that may have more to do with safe-haven flows during the equity selloff than anything fundamental. If risk sentiment turns, JPY could reverse sharply. Take a look at the daily JPY chart below.
I hope you enjoyed this article. This is not investment advise and all views are my own. I write these articles because they help me to stay disciplined and transform my thoughts into actionable trade ideas. I always appreciate your feedback, likes and comments!
Dear Mr. Repo.
Thanks once again for such a great piece.
I was curious on your thoughts about relative value trades rather than outright longs/shorts.
I've bactkested some basic risk parameters (nothing fancy, momentum and internals, but a way to characterize market status) and was thinking that, when both momentum and internals signal stress, it's probably more logical to try relative value trades than long or shorts.
For instance, a classic one I've been on/off (stopped out more than once) was long 10y bonds vs Short SPY (Vol adjusted sizes).
This trade doesn't necessarily limit beta exposure, given bonds and stocks tend to be differently behaved asset classes, but I've applied the same logic to, for instance, a long Argentinian stocks I placed last thursday on rumors of a new IMF plan and capital account controls being relaxed. I went long a few very liquid names there, but I shorted the SPY against them (vol adjusted again) because I wanted a cleaner expression of my view and not beta- or at least not as much.
I'm curious what you think about this idea of relative value plays when markets are more stressed, and if there's a way (probably more than one) that you use to characterize market structure and if and how that affects portfolio construction and stop loss/position sizing.
I do think it's a traders' market and I believe investor are better off being flat risk here, or at least heavily reducing exposure until more clarity arrives.
Thanks again for your writings, really enjoy them.
Best,
Valentino
Great write-up!