
Stress in Money Markets, the End of QT, and Year-End Trade Ideas
The Federal Reserve is moving to end QT as reserves tighten and money market rates spike. A closer look at the equity outlook and other trades heading into year-end.

Dear readers,
Before we dive into this week’s macro trade ideas, I want to share a quote from Stanley Druckenmiller from an interview in 2009. I listened to the interview this week, and I like the quote because it is honest and unfiltered. You can watch the full interview here.
„We don’t want to target asset prices, but for some reason we are buying them.“ - Stanley Druckenmiller about the Federal Reserve, 2009
With that quote in mind, let’s talk about the Federal Reserve and why it will remain supportive for risk assets in the next 12 months.
The Federal Reserve Will Stop QT - What Does That Mean?
This week’s Fed news centered on Quantitative Tightening (QT). The key headlines from Chair Powell said it all:
POWELL: STARTING TO SEE A LITTLE TIGHTENING IN MONEY MARKETS
POWELL: FED MAY END BALANCE-SHEET RUNOFF IN COMING MONTHS
I expect the Federal Reserve to slow or halt QT around October or December. Currently, the Fed is reducing its balance sheet by $40 billion per month - $5 billion in Treasuries and $35 billion in MBS.
Pausing QT now makes sense. The priority should shift toward maintaining ample reserves and preventing stress in funding markets. Money market rates have grown noticeably more volatile in recent months. The below chart shows the spread between SOFR and the RRP.
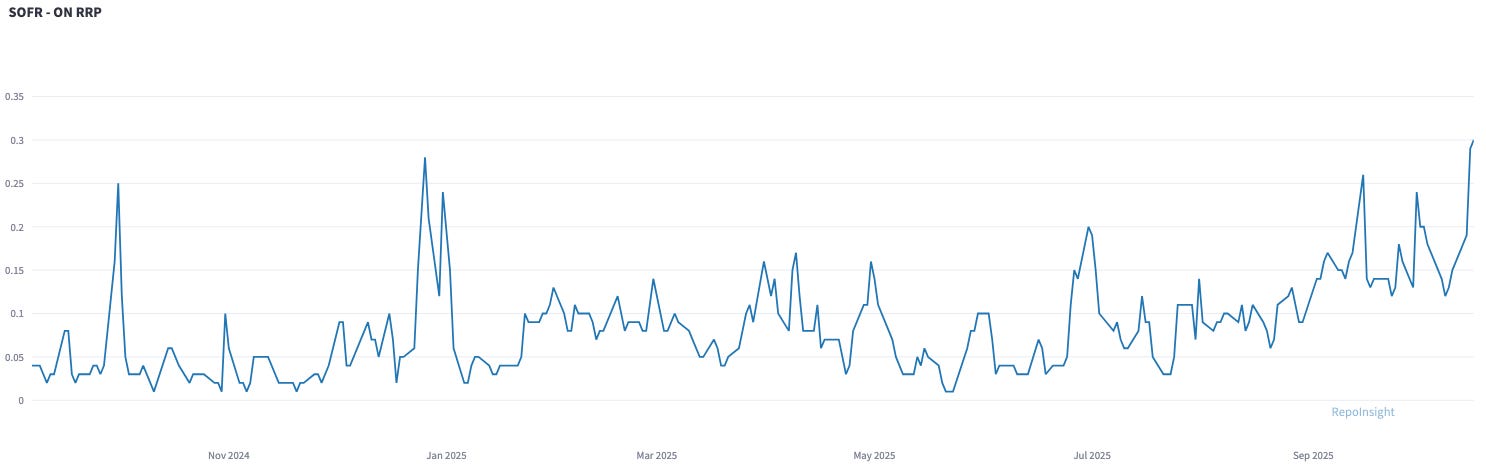
This week, SOFR once again spiked above the upper bound of the Fed funds target range. The move was driven by heavy Treasury issuance - meaning cash flowed out of the repo market - and notably, it did not coincide with a typical snapshot date such as month- or quarter-end.
SOFR, being a repo rate, can rise sharply for three main reasons:
Too little cash in the system,
Too much collateral relative to available cash, or
Balance sheet constraints around reporting dates (e.g., month- or quarter-end).
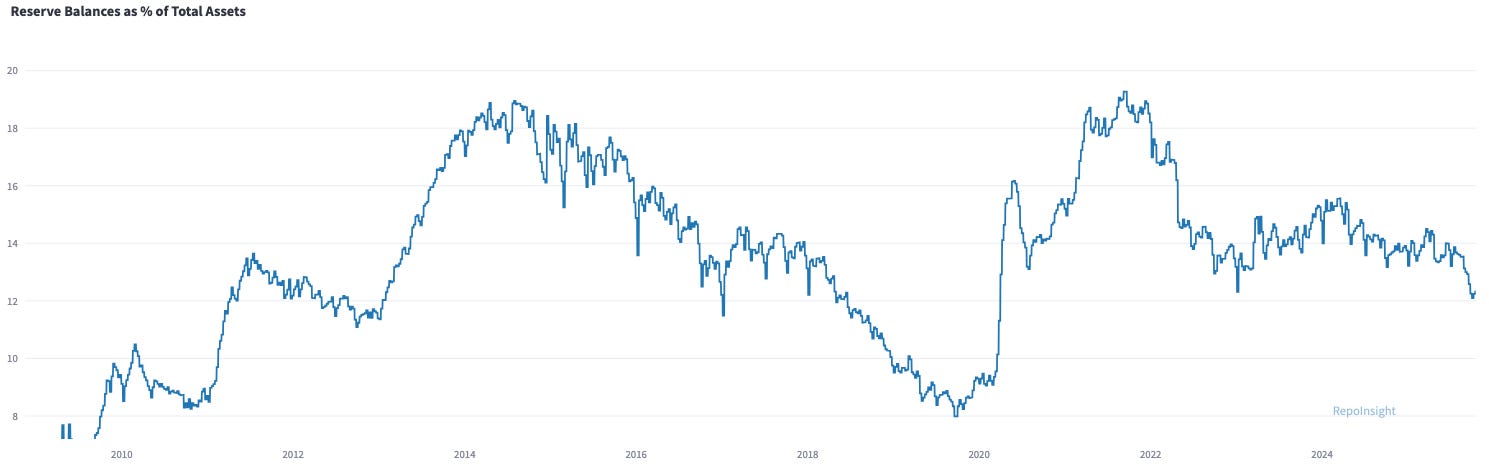
This latest spike reflected the first and second factor - a shortage of cash to absorb new Treasury supply. Bank reserves have now dropped below $3 trillion, hovering near 12% of total bank assets (see chart below). Reserves are no longer abundant; they’re gradually transitioning from ample to scarce.
Since the Great Financial Crisis, banks have been subject to a range of regulatory requirements. The most important one for reserve levels is the Liquidity Coverage Ratio (LCR), which requires banks to hold enough high-quality liquid assets (HQLA) to withstand 30 days of severe funding stress (=outflows).
Because bank reserves count as HQLA at a 100% weighting, they are highly valuable from an LCR perspective. Banks therefore maintain a baseline level of reserves and likely operate with internal thresholds for how much of their HQLA must be in the form of reserves.
In short, the system’s need for roughly $3 trillion in reserves today is a direct byproduct of post-GFC regulation. As banks’ total assets expand over time - roughly in line with nominal GDP - so does the structural demand for reserves.
Halting QT and allowing reserves to grow 3–5% annually isn’t a form of monetary easing; it’s prudent reserve management. And evidence increasingly points to scarcity rather than abundance - for instance, the effective fed funds rate (EFFR) has recently spiked relative to the interest on reserve balances (IORB), as shown below.
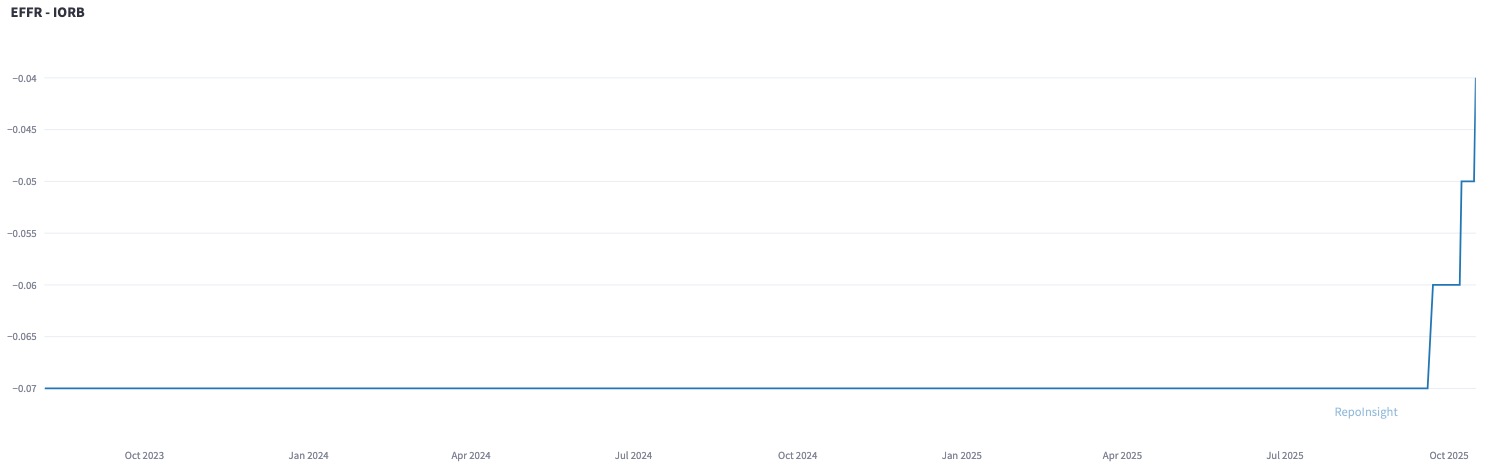
What does this mean? The effective federal funds rate (EFFR) is the overnight unsecured lending rate in the Fed funds market - a market largely dominated by foreign banks rather than U.S. domestics. The interest on reserve balances (IORB), by contrast, is the rate the Federal Reserve pays banks on their reserve holdings.
When the EFFR rises relative to the IORB, it signals tightening liquidity - a sign that reserves are becoming scarce and banks are turning more to unsecured overnight borrowing. For more than two years, the EFFR–IORB spread held steady at around 7 basis points. It’s now showing early signs of stress.
The Federal Reserve’s “Reserve Demand Elasticity” model was last updated on October 10th. The model “shows by how many basis points the spread between the federal funds and IORB rates would move for an increase in aggregate reserves equal to 1 percent of banks’ total assets.” It is worth monitoring.
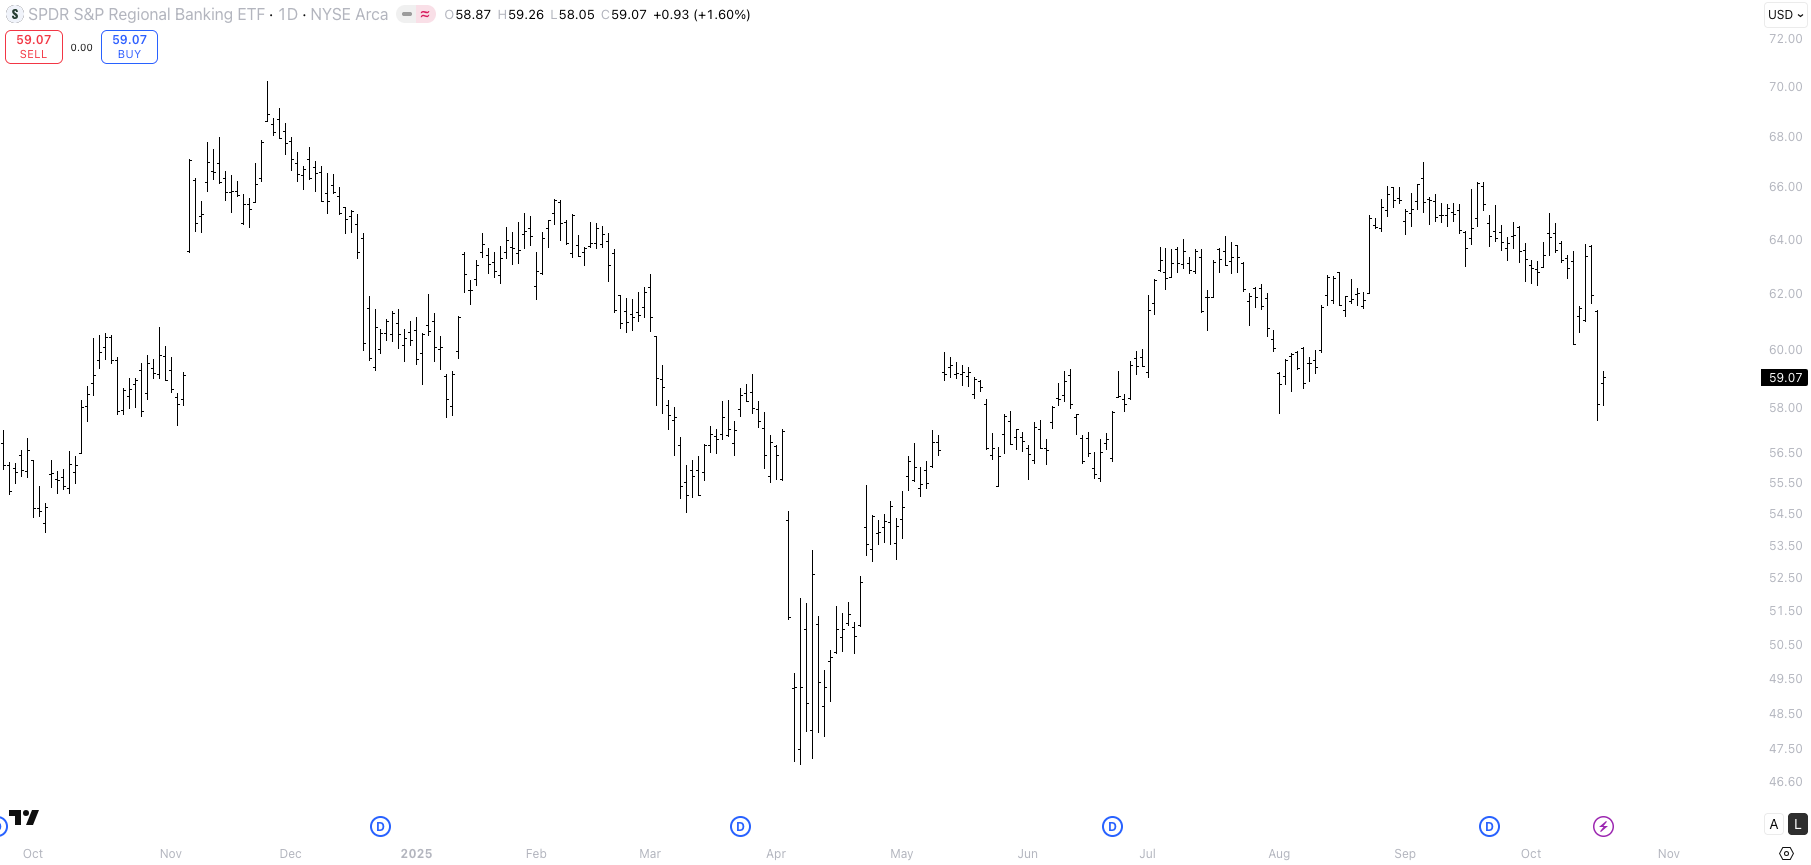
The large U.S. banks, such as J.P. Morgan and Goldman Sachs, remain well-capitalized. However, funding stress may be emerging at smaller regional banks that lack direct access to U.S. repo markets. The equity market appears to share this concern - the KRE regional bank ETF sold off sharply on Thursday.
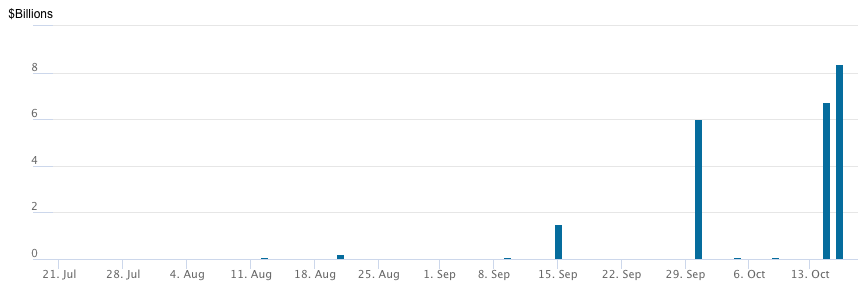
Usage of the Federal Reserve’s standing repo facility remains low - around $8 billion on Thursday. There’s no funding crisis, but there’s also no reason to risk one. I expect the Fed shares this view and will adjust its QT policy later this year.
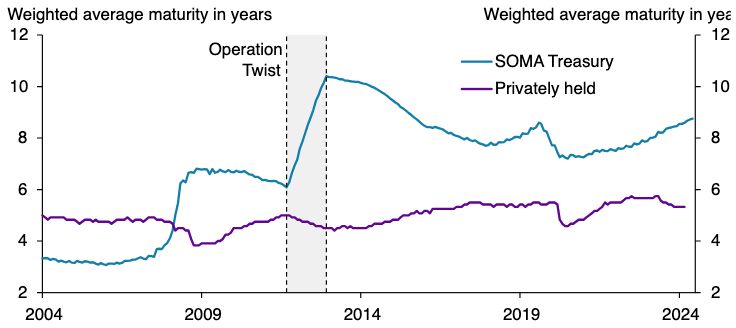
Rather than focusing on QT, the Federal Reserve should reconsider its reinvestment policy. In my view, the Fed should avoid reinvesting proceeds from Treasury and MBS maturities into Treasuries with maturities beyond five years. Ideally, the weighted-average maturity (WAM) of Treasuries in the SOMA portfolio should align with the WAM of total outstanding Treasury debt.
Currently, the Fed reinvests heavily in long-dated Treasuries, effectively easing monetary policy by shouldering duration risk that the private sector would otherwise bear. I believe the Fed should limit reinvestments to bills and Treasuries under five years. This would likely push long-end yields higher, allowing rates to find their “true” equilibrium and reducing market distortions over the long term.
But my opinions on what the Federal Reserve should do don’t matter for trading. What matters is what the Fed is actually doing right now. Pausing QT, maintaining a long-end bias in reinvestments, and cutting rates all constitute easy monetary policy. The Fed is likely to continue supporting markets over the next year, and as the saying goes…

This was a long section about monetary policy and money markets. Let’s dive into the usual macro topics.
Equities - Taco-Trump Supports Markets
When Trump announced 100% tariffs on China last Friday, the S&P 500 dropped 3%. And what did retail investors do? According to BofA, last week marked the fifth-largest single-stock inflow and the largest weekly inflow on a down week of 1% or more in the past 15 years - retail bought the dip.
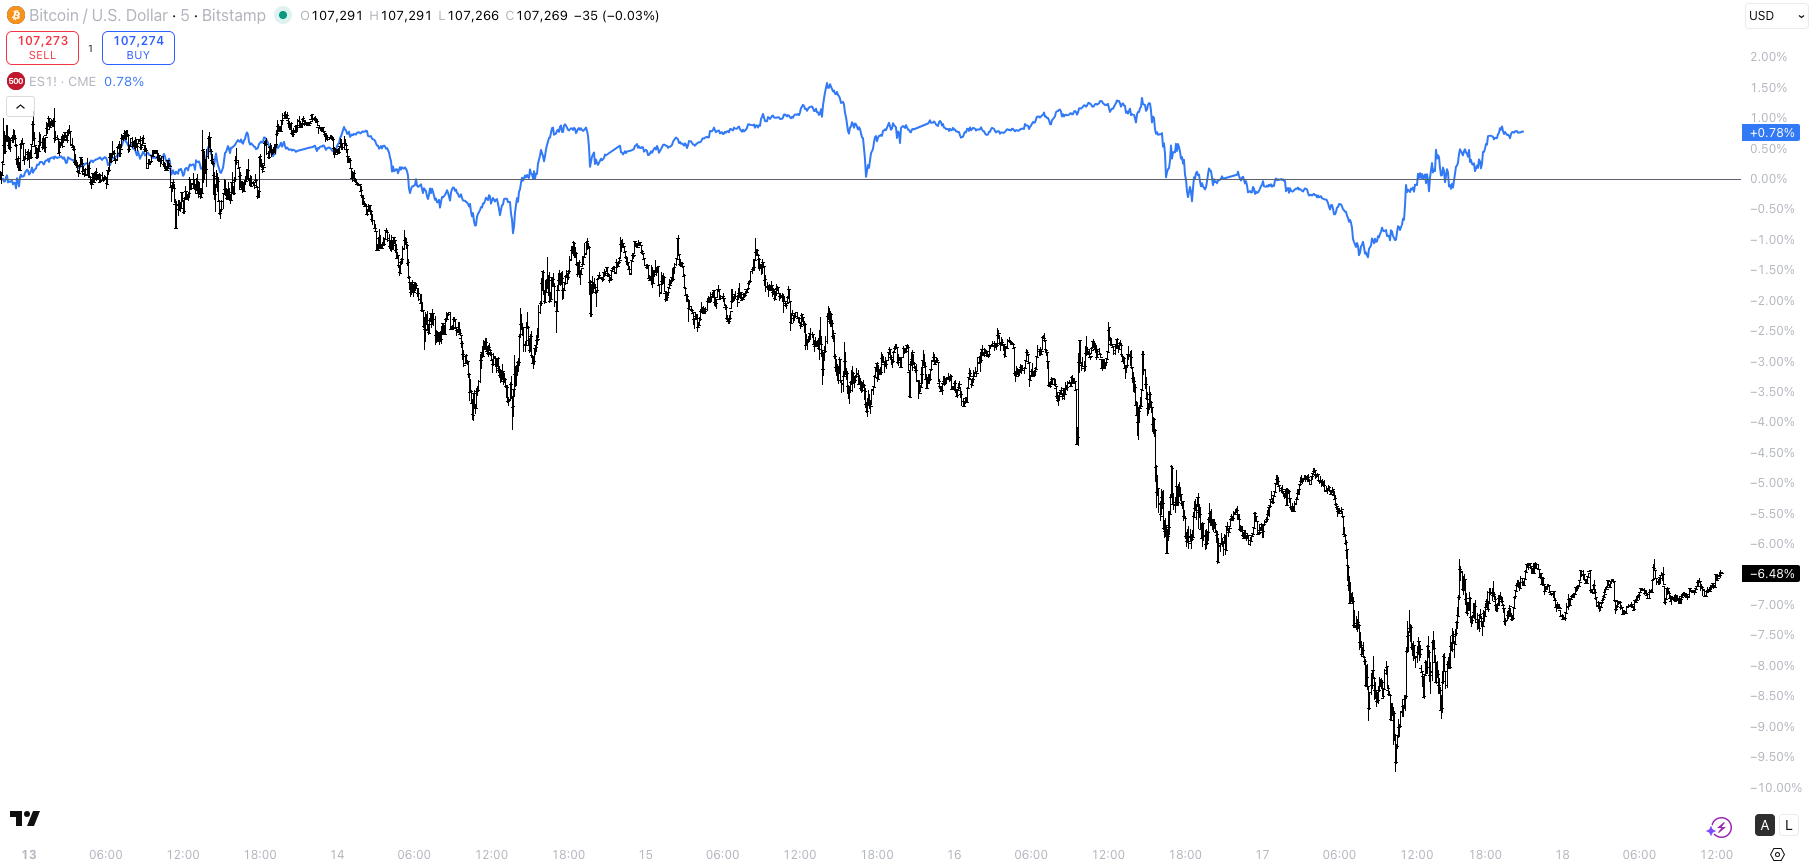
Despite this, equities feel vulnerable. The recent crypto liquidation also failed to attract buying, with Bitcoin and most major coins selling off over the past few days. The chart below shows the S&P 500 (blue) and Bitcoin (black) since the start of the week - a clear hint of risk-off sentiment, even as Trump tries to keep markets afloat.
On Thursday, Taiwan Semiconductor reported blowout earnings, raised its revenue outlook for 2025 to mid-30% growth, and expects gross and operating margins to increase ~3% in Q4. The CEO highlighted growing conviction in the AI megatrend. Yet the S&P 500 sold off on this bullish news.
Equities are trading weaker, though some of this may be seasonal. Historically, the Q4 seasonal low occurs around October 26, followed by strong corporate buyback flows in November and December. I’m cautious about turning too bearish ahead of year-end - Trump is “taco’ing” hard. Relevant headlines from Friday:
TRUMP: SUCH HIGH TARIFFS ON CHINESE GOODS NOT SUSTAINABLE
TRUMP, ASKED IF HIGH CHINA TARIFFS WILL STAND: NO
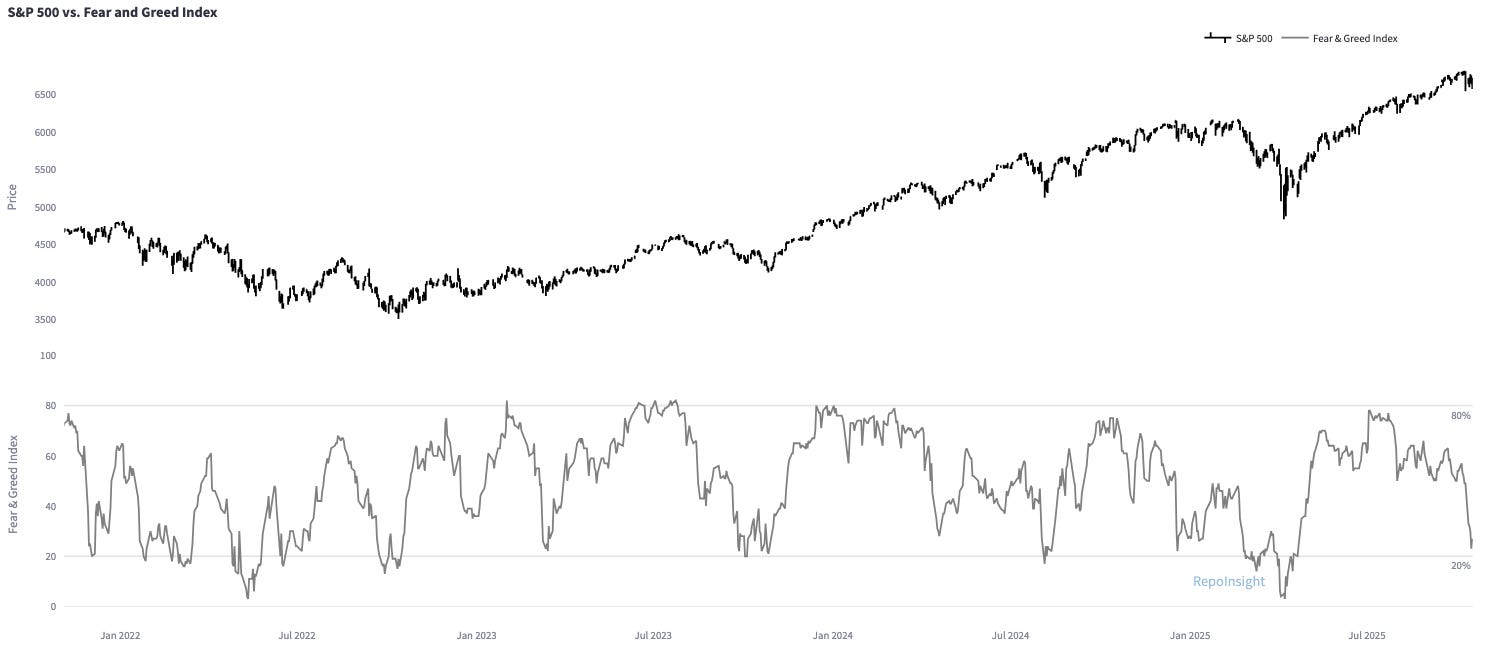
Vol-targeting funds have reduced equity exposure. Even with reported retail inflows, sentiment surveys remain oddly bearish. The AAII survey shows 46% of retail investors expect the market to fall in the next six months, well above the 31% average, while the Fear & Greed Index has dipped back into “Fear” territory (see below).
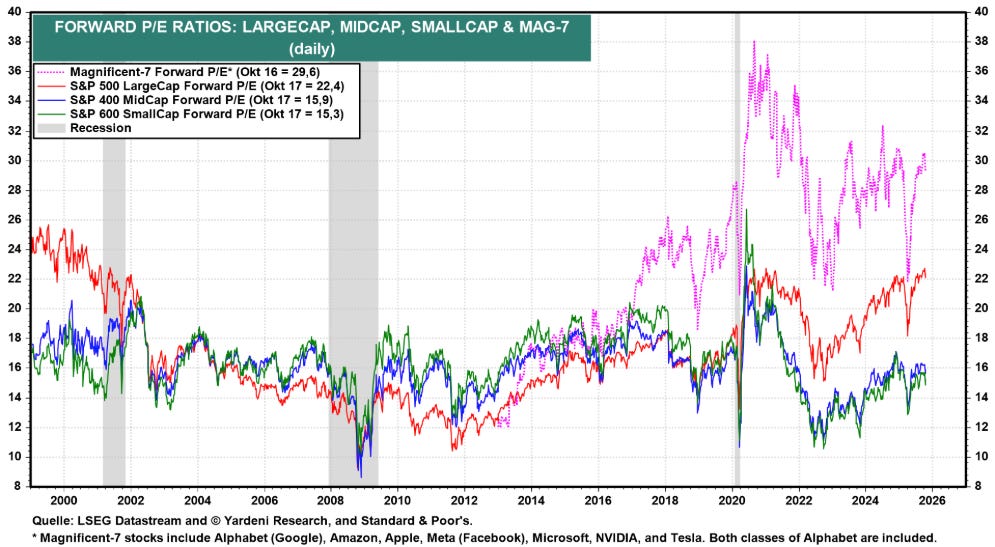
Valuations are high. The S&P 500’s forward P/E (red) has climbed to 22.4x, reaching 2021 levels. The Mag-7 trade at 29.6x forward earnings (pink), while small caps remain much cheaper at 15–16x (blue & green). To be fair, the S&P 500 is now effectively a quality index, and the Mag-7 consistently beat earnings expectations. Still, valuations aren’t a tailwind - earnings must deliver.
Instead of focusing solely on the S&P 500, other opportunities deserve attention. One area is the Nifty 50, India’s benchmark index, which is breaking out after more than a year of consolidation (see chart below).
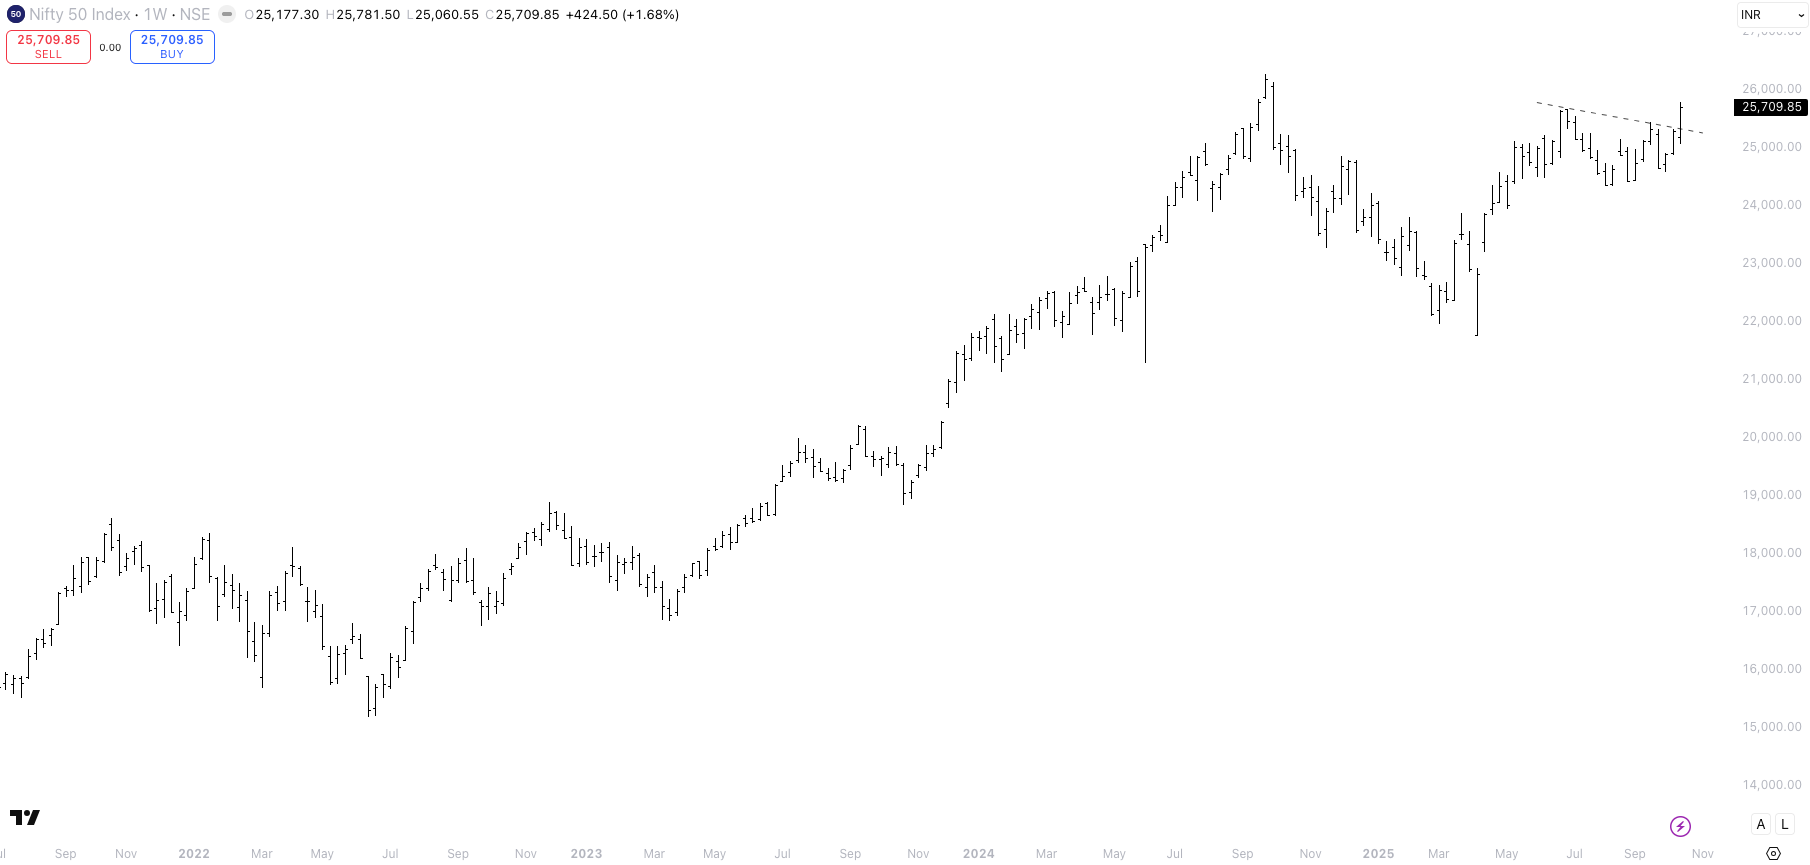
Why Indian equities? India grows at 6–7% annually, has the largest population in the world, and its average GDP per capita is $2,700 - far below the U.S. at $85,800 - suggests the average Indian wants to become more wealthy. India also maintains strong ties with the United States.
Narendra Modi, India’s Prime Minister, was Gujarat’s chief minister from 2001 to 2014. He turned Gujarat with a population of 74 million people into India’s economic powerhouse. Its GDP per capital of $3,947 exceeds India’s average. The state is predicted to become a $1tn economy in 2035.
Prime Minister Narendra Modi, former Chief Minister of Gujarat (2001–2014), transformed the state of 74 million into India’s economic powerhouse, with GDP per capita of $3,947 above the national average. Gujarat is projected to become a $1 trillion economy by 2035. Modi plans to extend Gujarat’s model nationally, and I think it could succeed.
The Nifty 50 trades at a P/E of 23, which seems reasonable given India’s growth trajectory. I initiated a new position in my long-term account this week and plan to scale it up in the coming weeks.
Another area of interest is the U.S. commodity sector. Bloomberg’s commodity index (BCOM) may be breaking out of its two-year consolidation (see chart below).
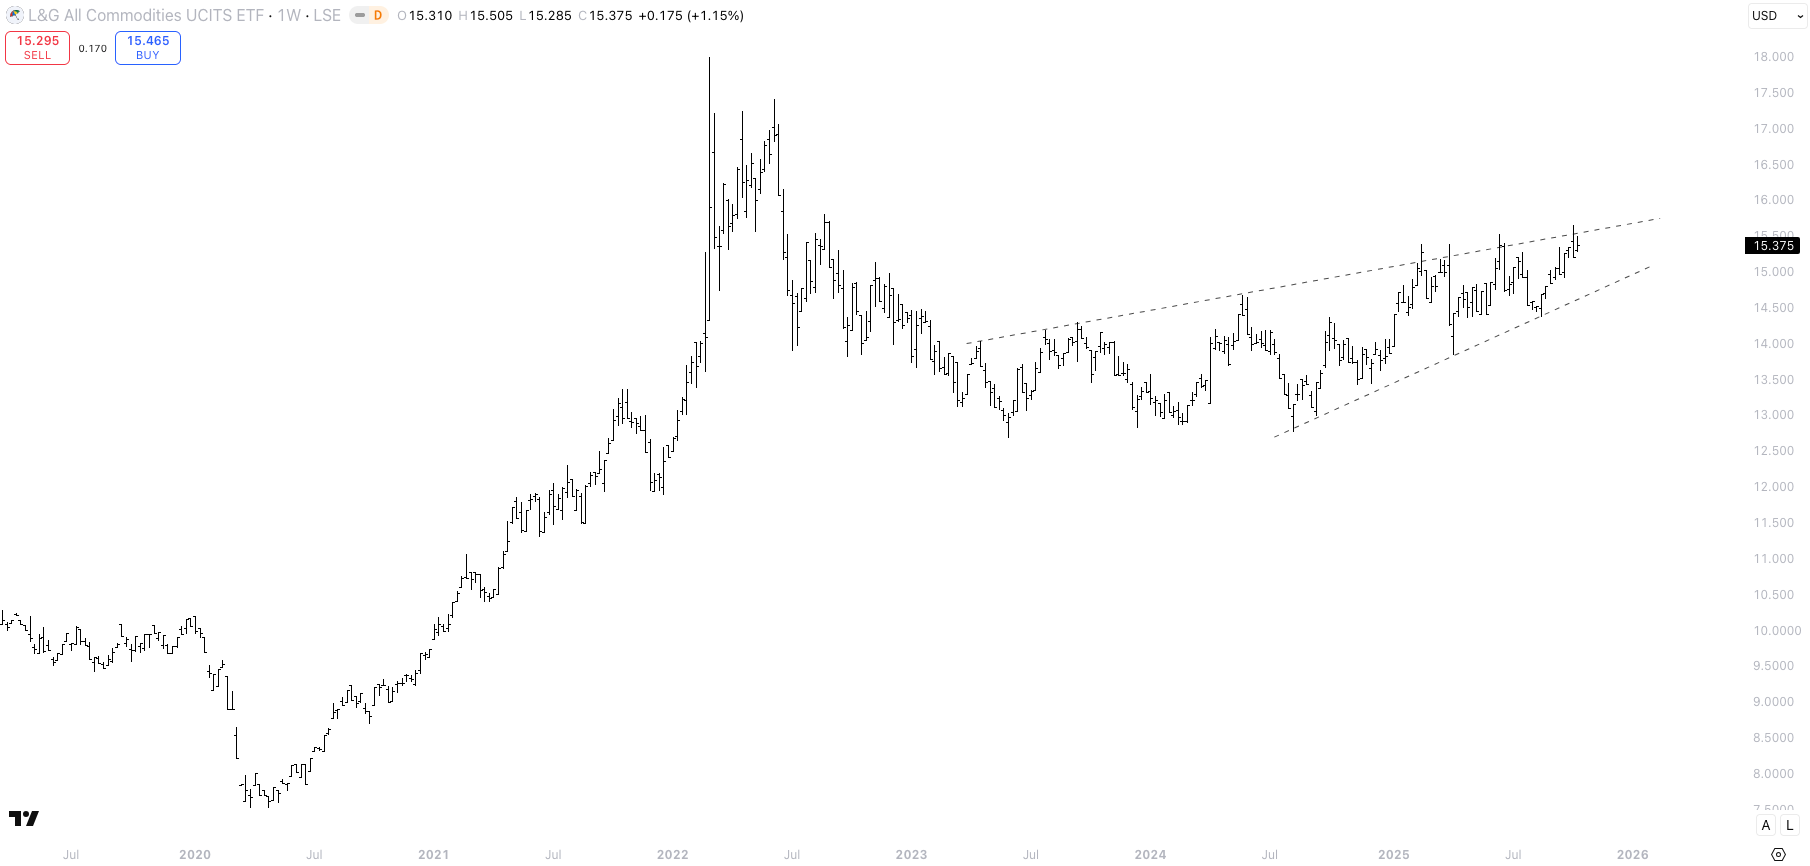
I know - many investors have been burned by commodities. Tech has dominated the past decade, and few expect that to change soon. Yet several catalysts suggest commodities could outperform over the next decade:
Most major economies - the United States, Europe, China and Japan - have massively increased their fiscal stimulus outside of recessions. That should lead to increased commodity demand.
Stressed supply chains and rising geopolitical tensions may lead governments and large corporations to strategically hoard resources, including rare earth metals.
The AI megatrend is increasing energy demand; copper (cables), silver (solar), and natural gas consumption are likely to rise.
U.S. shale oil production may soon peak, pushing the clearing price for new oil higher. And Goldman Sachs projects Russian oil production to fall 10% in 2026, from 9.3 to 8.4 million barrels per day (The Telegraph).
The current LNG build-out is the largest in history, driving further natural gas demand (take a look at Citrini Research’s latest piece).
Supply is unlikely to catch up quickly. Lead times for new mines (gold, copper, nickel, lithium) started between 2020–2023 average 17.9 years - extreme, but illustrative. Demand is set to rise over the next five years, while new supply lags.
In my opinion, the Nifty 50 and the commodity sector are good diversifiers for a long-term investment in the S&P500.
Other Views - A Quick Rundown
I am a bit short on time this weekend (I spent too much time writing the monetary policy part!). I wanted to re-iterate a few views that I have already communicated in previous articles:
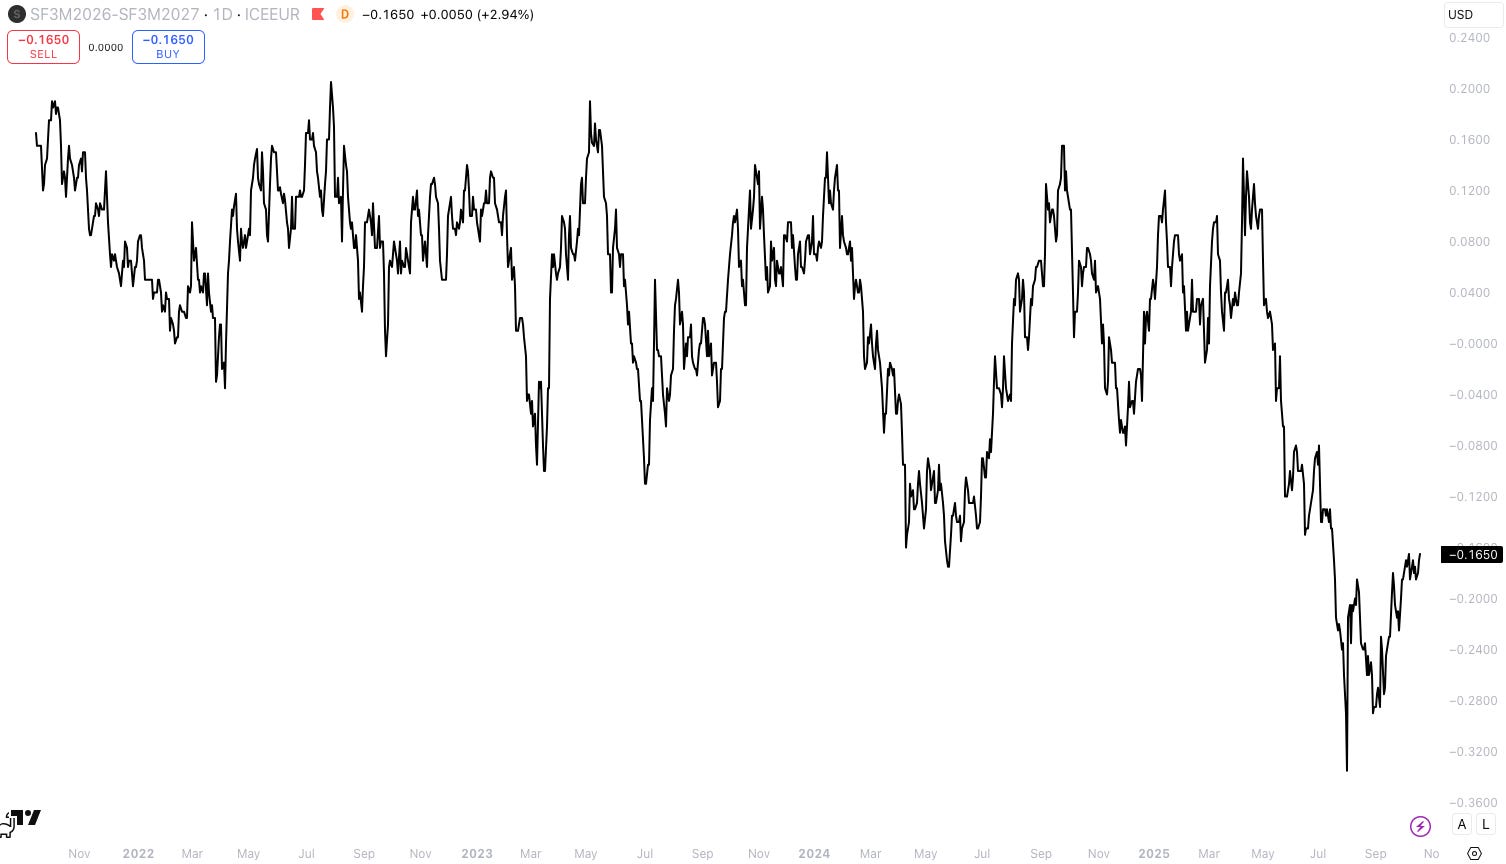
SOFR Curve - Bearish Bias
I don’t have strong conviction on the SOFR curve right now, but I lean short, i.e., cuts need to get priced out. There are two big questions: 1) Is inflation going to remain sticky or even re-accelerate and if yes, 2) Will the Fed care?
With nominal GDP growing at >5%, core PCE closer to 3% than 2%, and the unemployment rate at 4.3% close to cycle lows, there is no reason to cut interest rates right now (in my view).
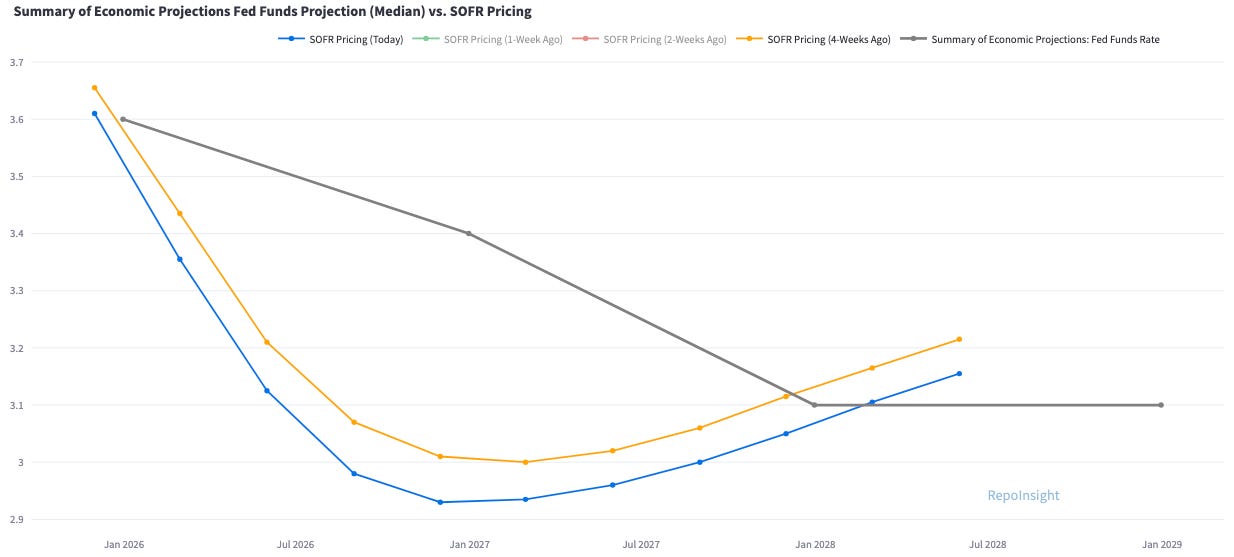
The SOFR curve is pricing more than 2x cuts in 2025 and more than 3x cuts in 2026. That’s significantly more than the Fed communicated in the latest SEP.

We should probably expect Jerome Powell to cut LESS than priced in. And the new Fed Chair to cut MORE than priced in to please Trump. We could express this view by selling SOFR June 2026 and buying SOFR June 2027. That spread is currently pricing 16.5bps of cuts.
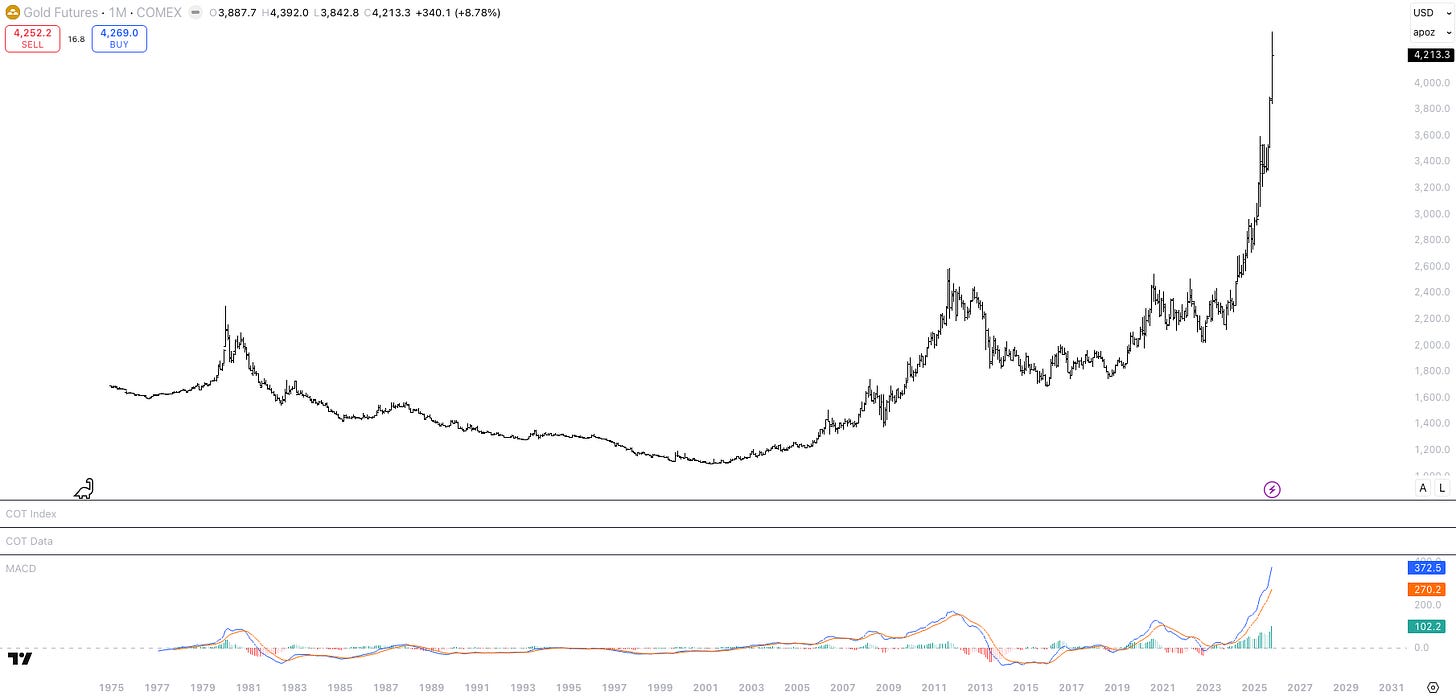
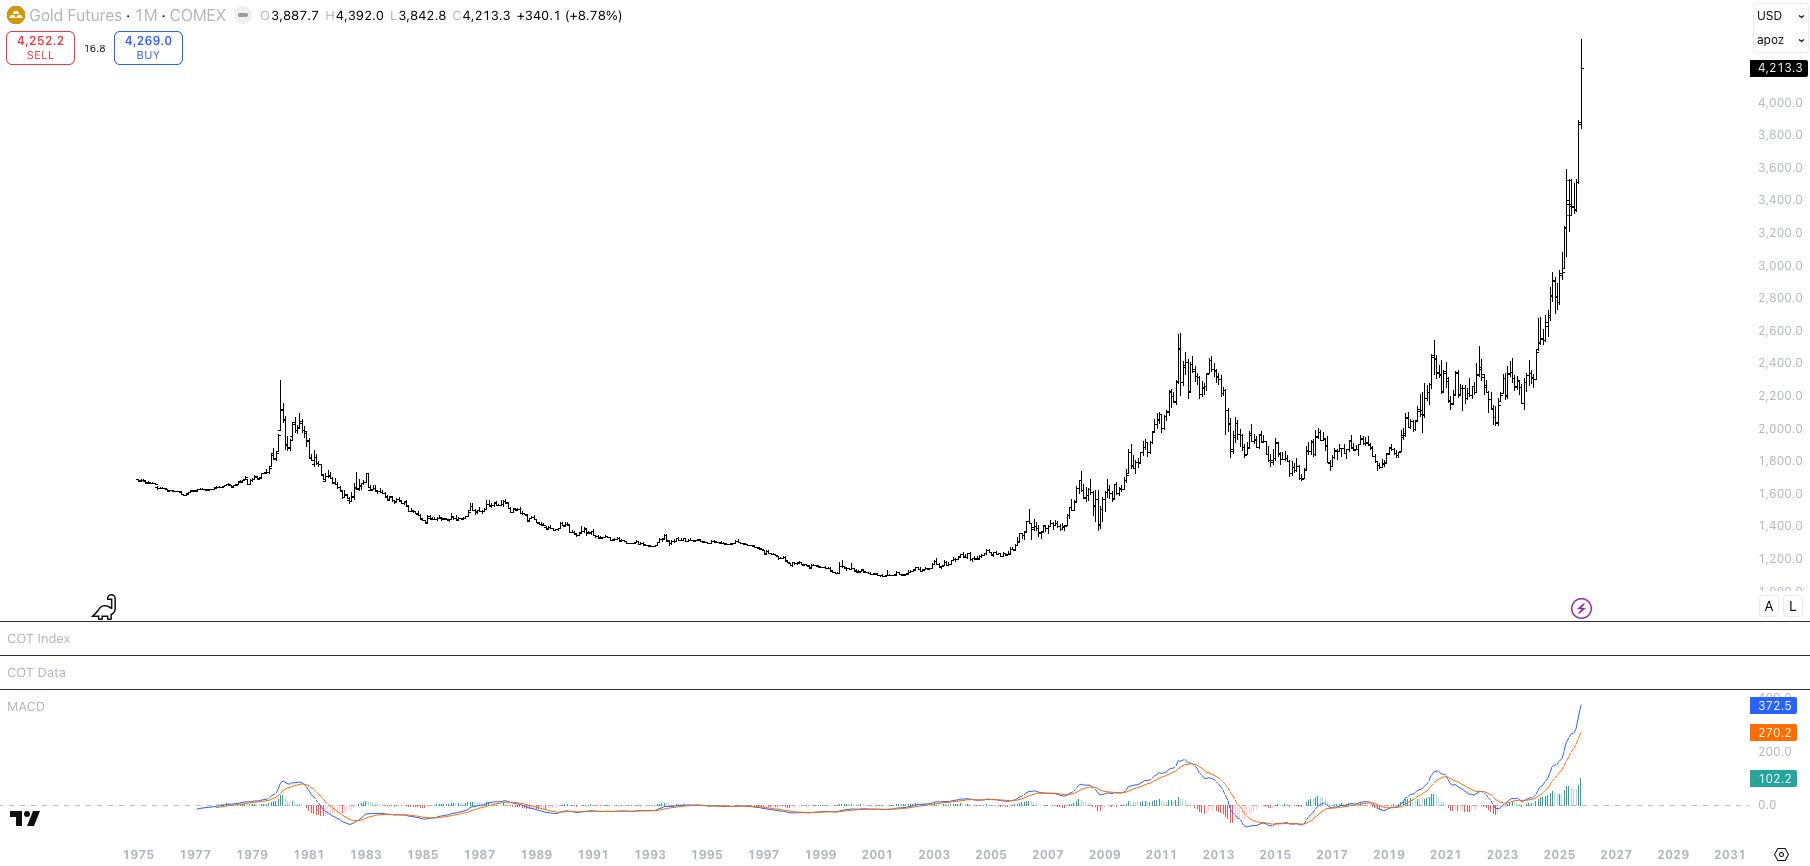
Gold - Everyone is looking for the reversal day
It is really annoying that we do not get any CoT data right now. That would confirm whether positioning is crowded yet. My best guess is that it is.
I read this headline this week: “Gold has surpassed the euro to become the 2nd largest global reserve asset,” per CNBC. That feels like a bubbly headline.
I understand the structural investment case for Gold, but I read “debasement trade” everywhere these days. Gold feels vulnerable to a reversal.
Take a look at the monthly MACD. It has reached the highest level in history (!).
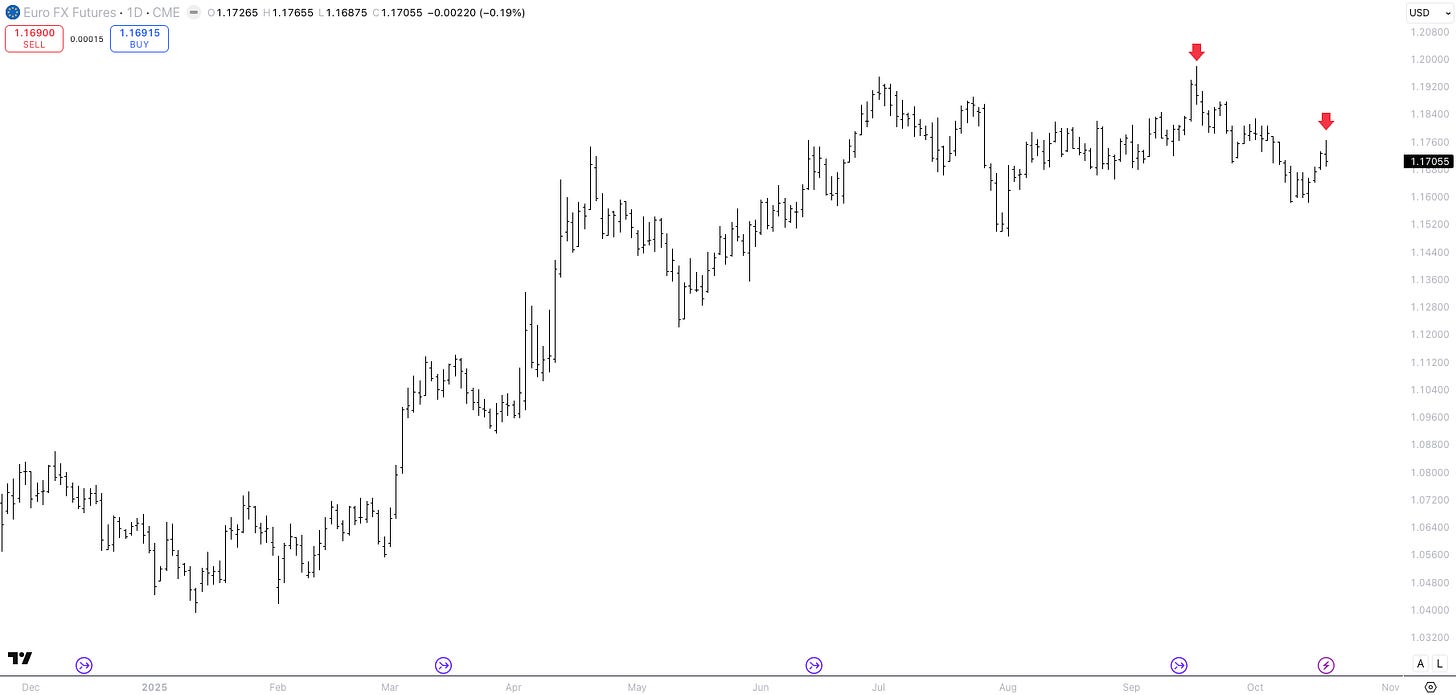
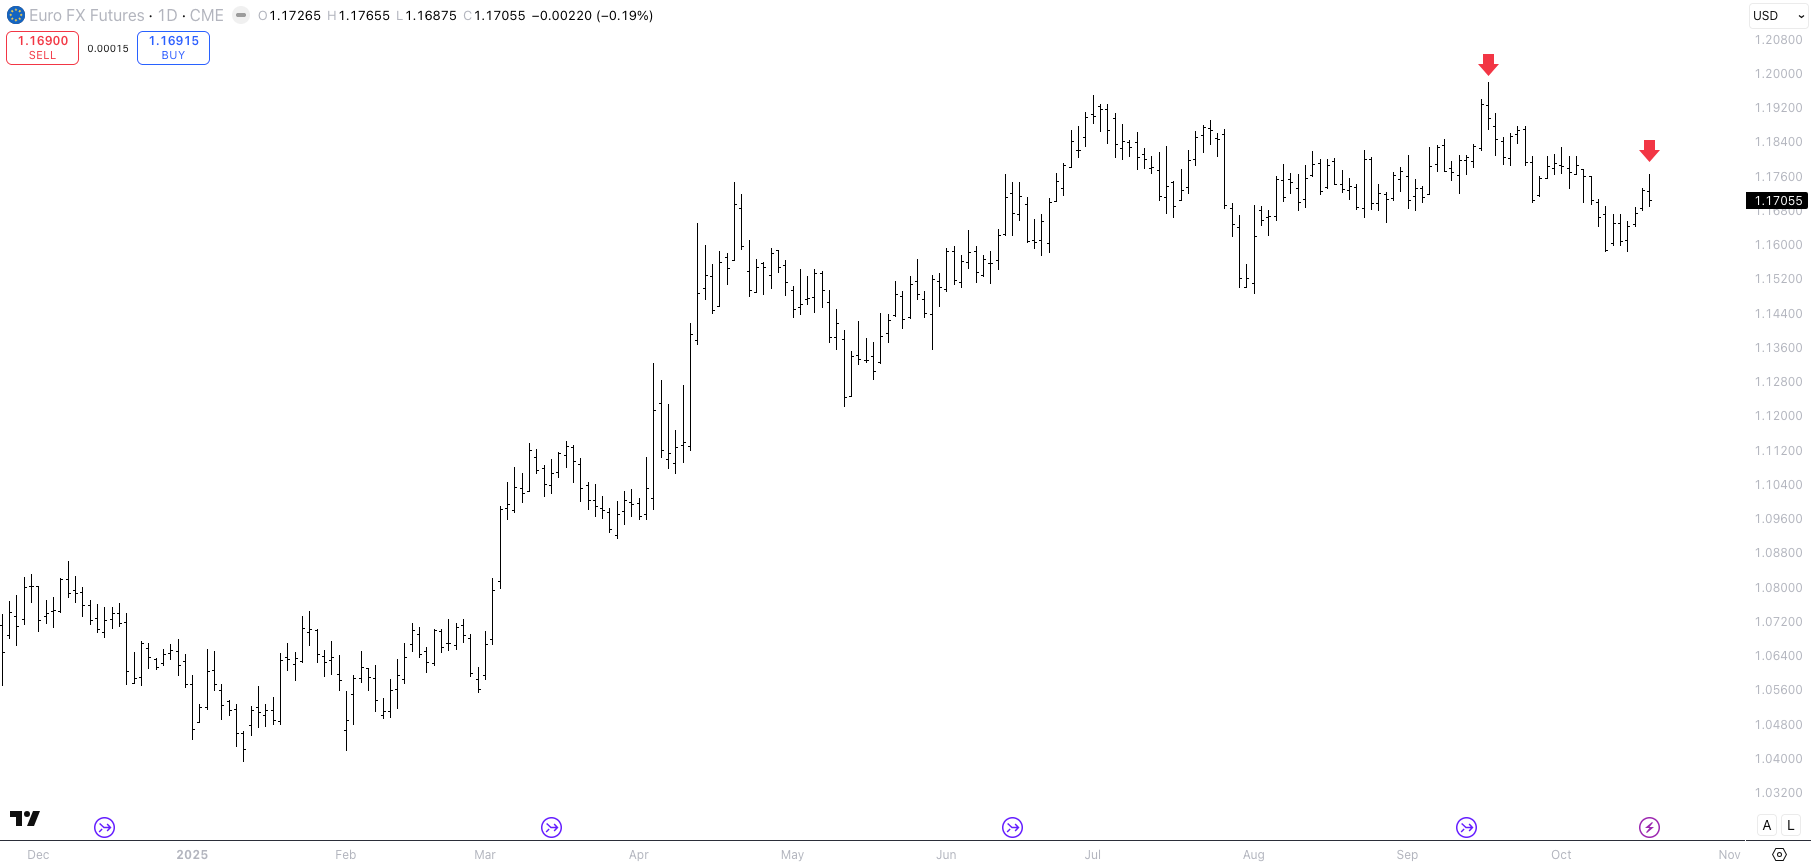
Euro - Nice reversal candle on Friday. Needs follow-through now.
I laid out my short Euro thesis many times in the past months. Friday’s reversal candle in the Euro was a first sign that weakness could persist post-FOMC dollar strength. I am still in my long USD cash position.
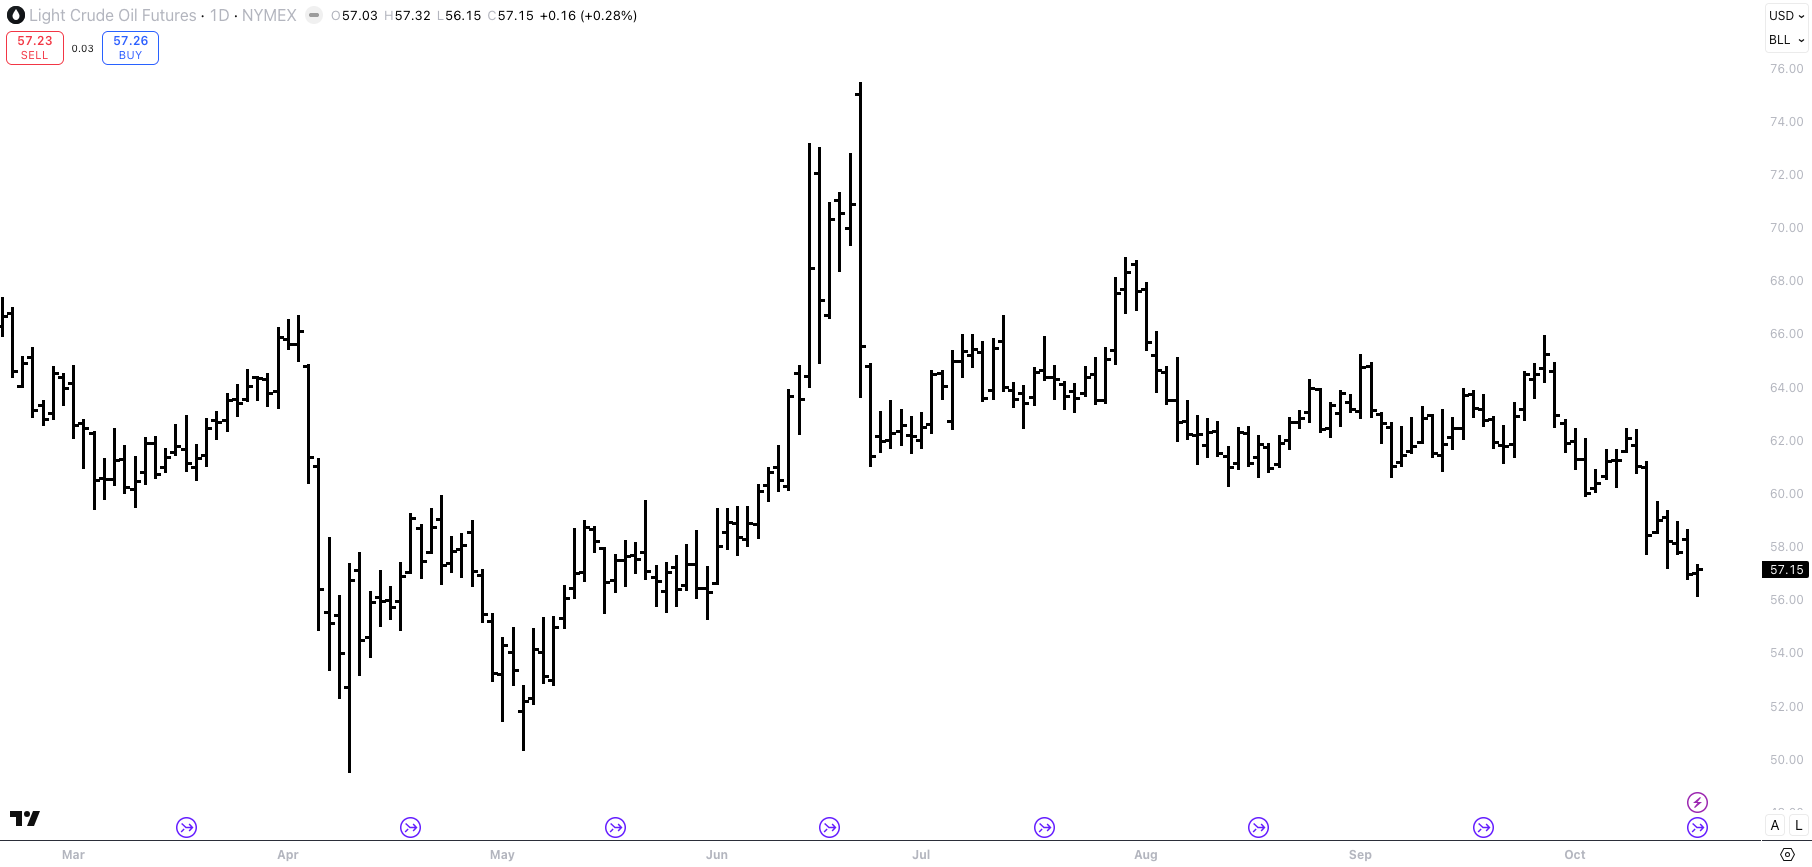
Crude oil - Everyone hates it.
I talked about crude oil, and massive short positioning from money managers. So far, they have been correct. But when they need to unwind their positions, it could get nasty. I am on the sidelines, but I am monitoring oil as a potential long.
P.S.: I know that I still need to change the watermarks in my charts - from RepoInsight to The Village Fund. I did not have time yet.
As always, an excellent article. I have a few questions regarding the premise that 'The Fed is likely to continue supporting markets over the next year.'
In this strong environment, would a steepener trade be a favourable strategy?
It seems plausible that interest rates will only reverse course once hard data confirms a genuine economic strengthening. Otherwise, the narrative you've presented appears to be already widely discussed, yet the 10-year Treasury yield continues to test the 4% mark. Given that tariff revenues are currently offsetting concerns about the fiscal deficit, coupled with the Fed maintaining a dovish stance, it feels unlikely that interest rates will experience a significant rebound.
Do you consider copper to be a superior choice compared to gold and silver at this juncture? Copper actually closed flat on Friday
Dear Mr. Repo,
Such a great piece overall, but I have to tell you that the plumbing section was truly amazing, thank you.
It always seemed to me to be a very complex issue, one that most pundits spend little time looking at (might make sense since probably it tends to work well), but also so systemically important that having an expert look and thoughts makes it very valuable.
Thank you for it!
Best,
Valentino