
A US growth slowdown. Repricing of the short-end, the US dollar and equities.
The Atlanta Fed GDP Nowcast is forecasting -1.5% GDP growth. The short-end is pricing 4x cuts until December 2026. Retail investor sentiment is at a 1-year bearish high. Making sense of it all.

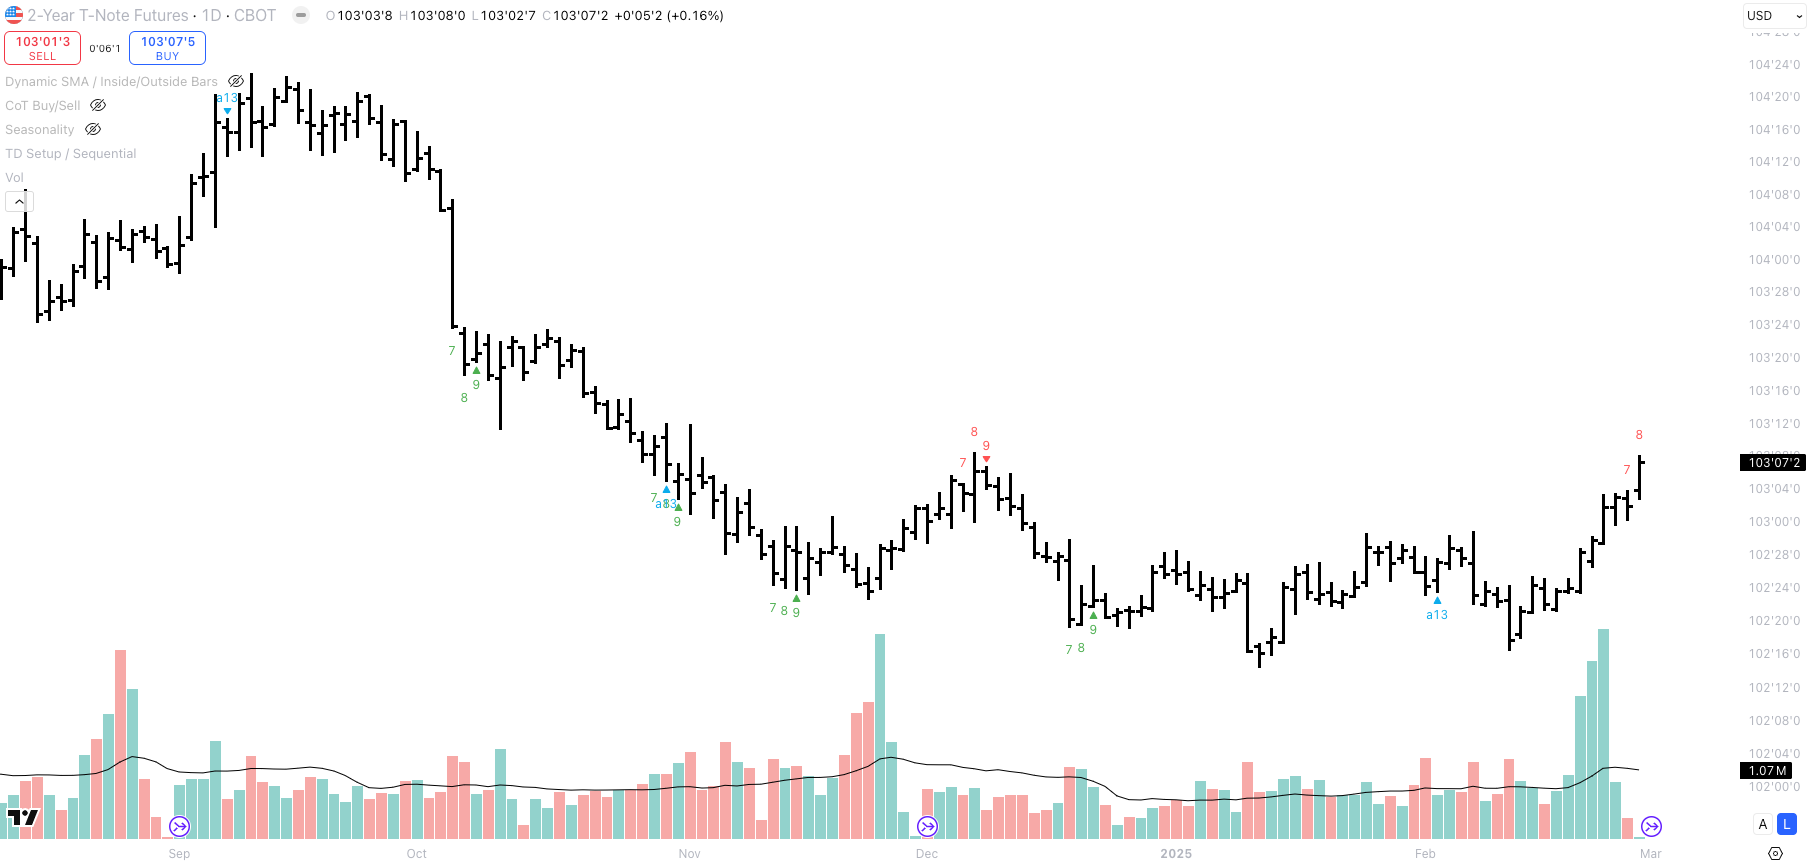
What a week for financial markets! My bullish view on the short end paid off. The threat of tariffs, shrinking fiscal deficits, and tighter immigration policies are all headwinds for economic growth. With inflation showing no signs of re-accelerating and the economy losing momentum, the Federal Reserve may cut rates more than once in 2025. Two-year yields dropped sharply, rallying from 4.39% to 3.99% in the last three weeks —a 40-basis-point move! The chart below shows the U.S. 2-year future. Don’t be misled by the elevated volume; it reflects investors rolling their March futures positions into the June future.
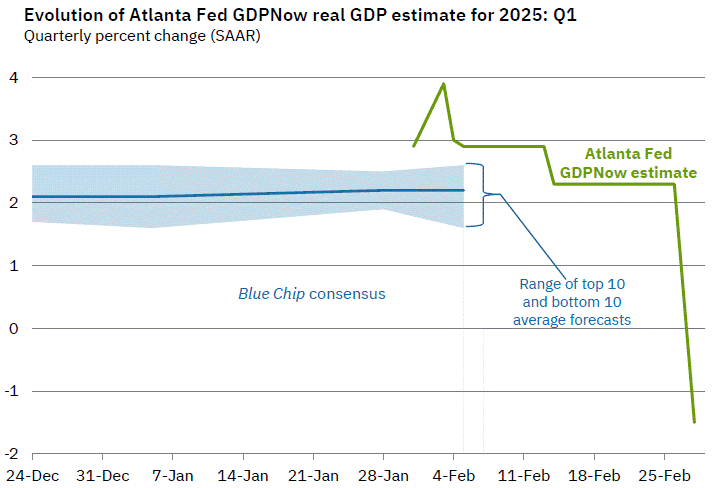
The Atlanta Fed GDP Nowcast rattled a few people on X on Friday. The GDP forecast for Q1-2025 was revised down from +2.3% to -1.5% (!). However, there is nothing to panic about. The nowcast dropped due to "front-running" of anticipated tariffs, where businesses accelerated imports of goods—particularly industrial supplies. The net exports contribution to Q1-2025 GDP growth dropped from -0.41% to -3.70%, which reflects a $250 billion shortfall in exports compared to imports. Once the inventory data is updated, the nowcast should move back up again.
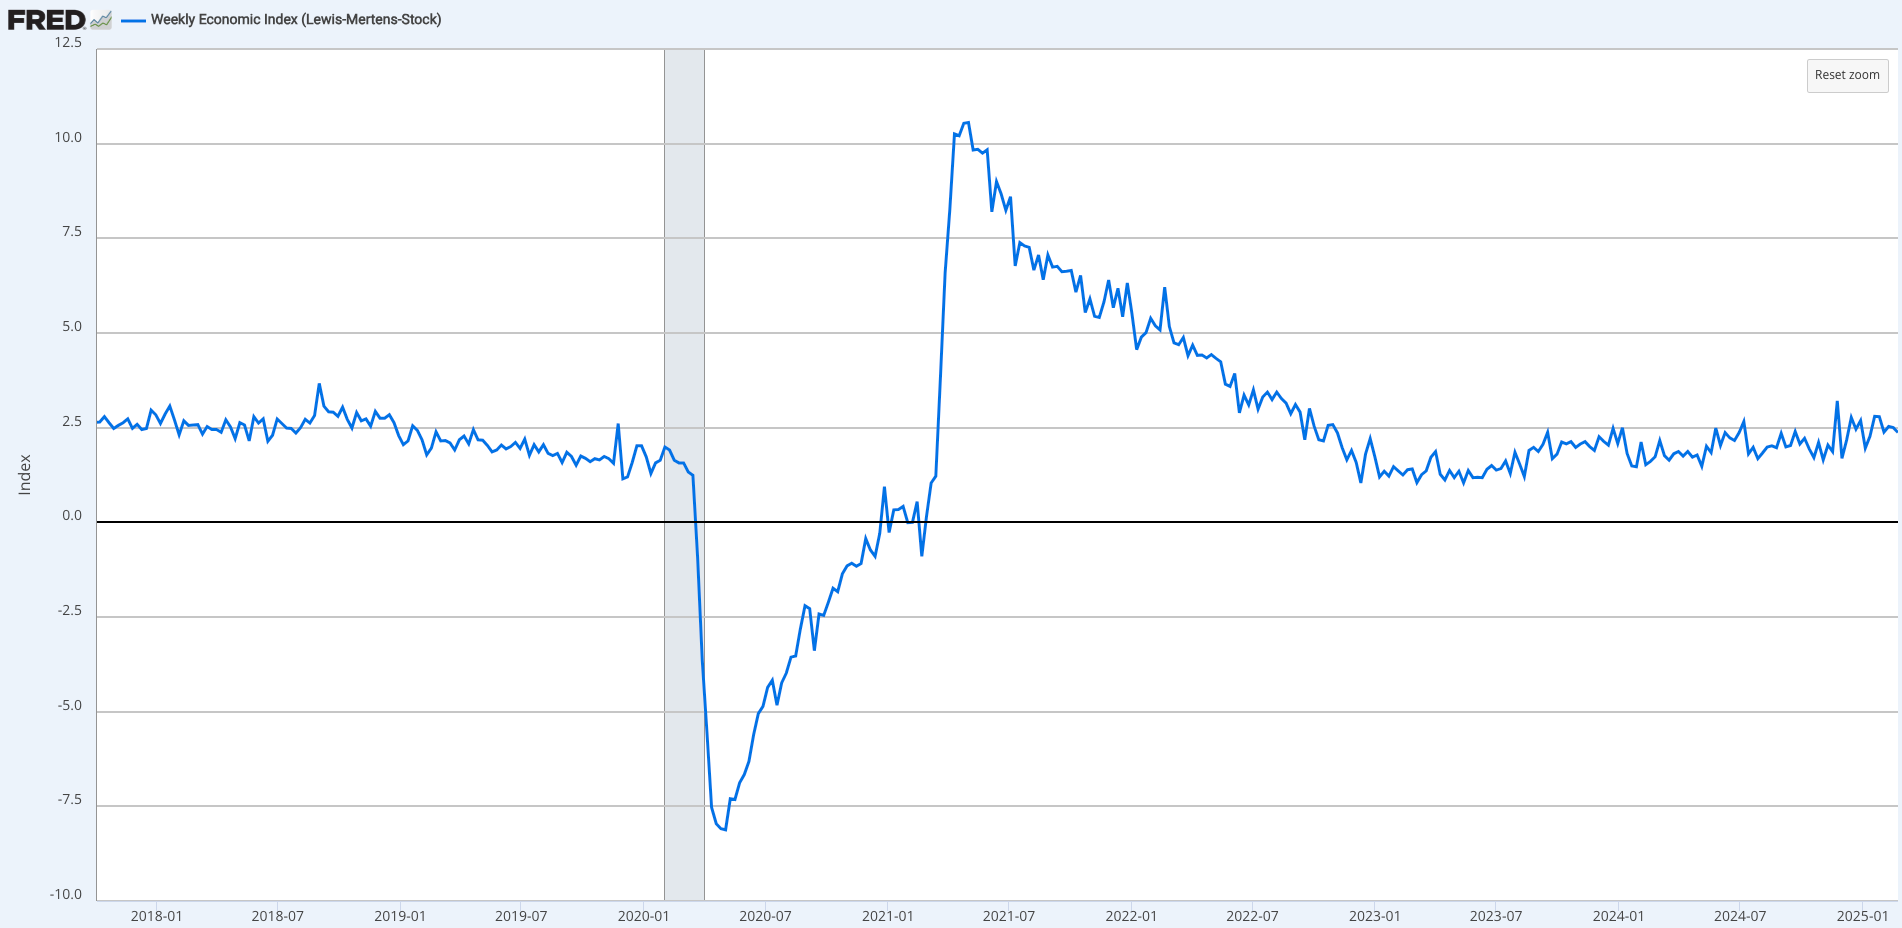
Durable goods orders came in stronger this week, 3.1% m/m vs. 2.0% expected. Core PCE, the Fed’s favourite measure of inflation, printed in line with expectations at 2.6% y/y. The Weekly Economic Index does not reflect a slowdown yet (see chart below). Still, the short-end rallying and equities selling off last week suggests the market is pricing in weaker growth ahead.
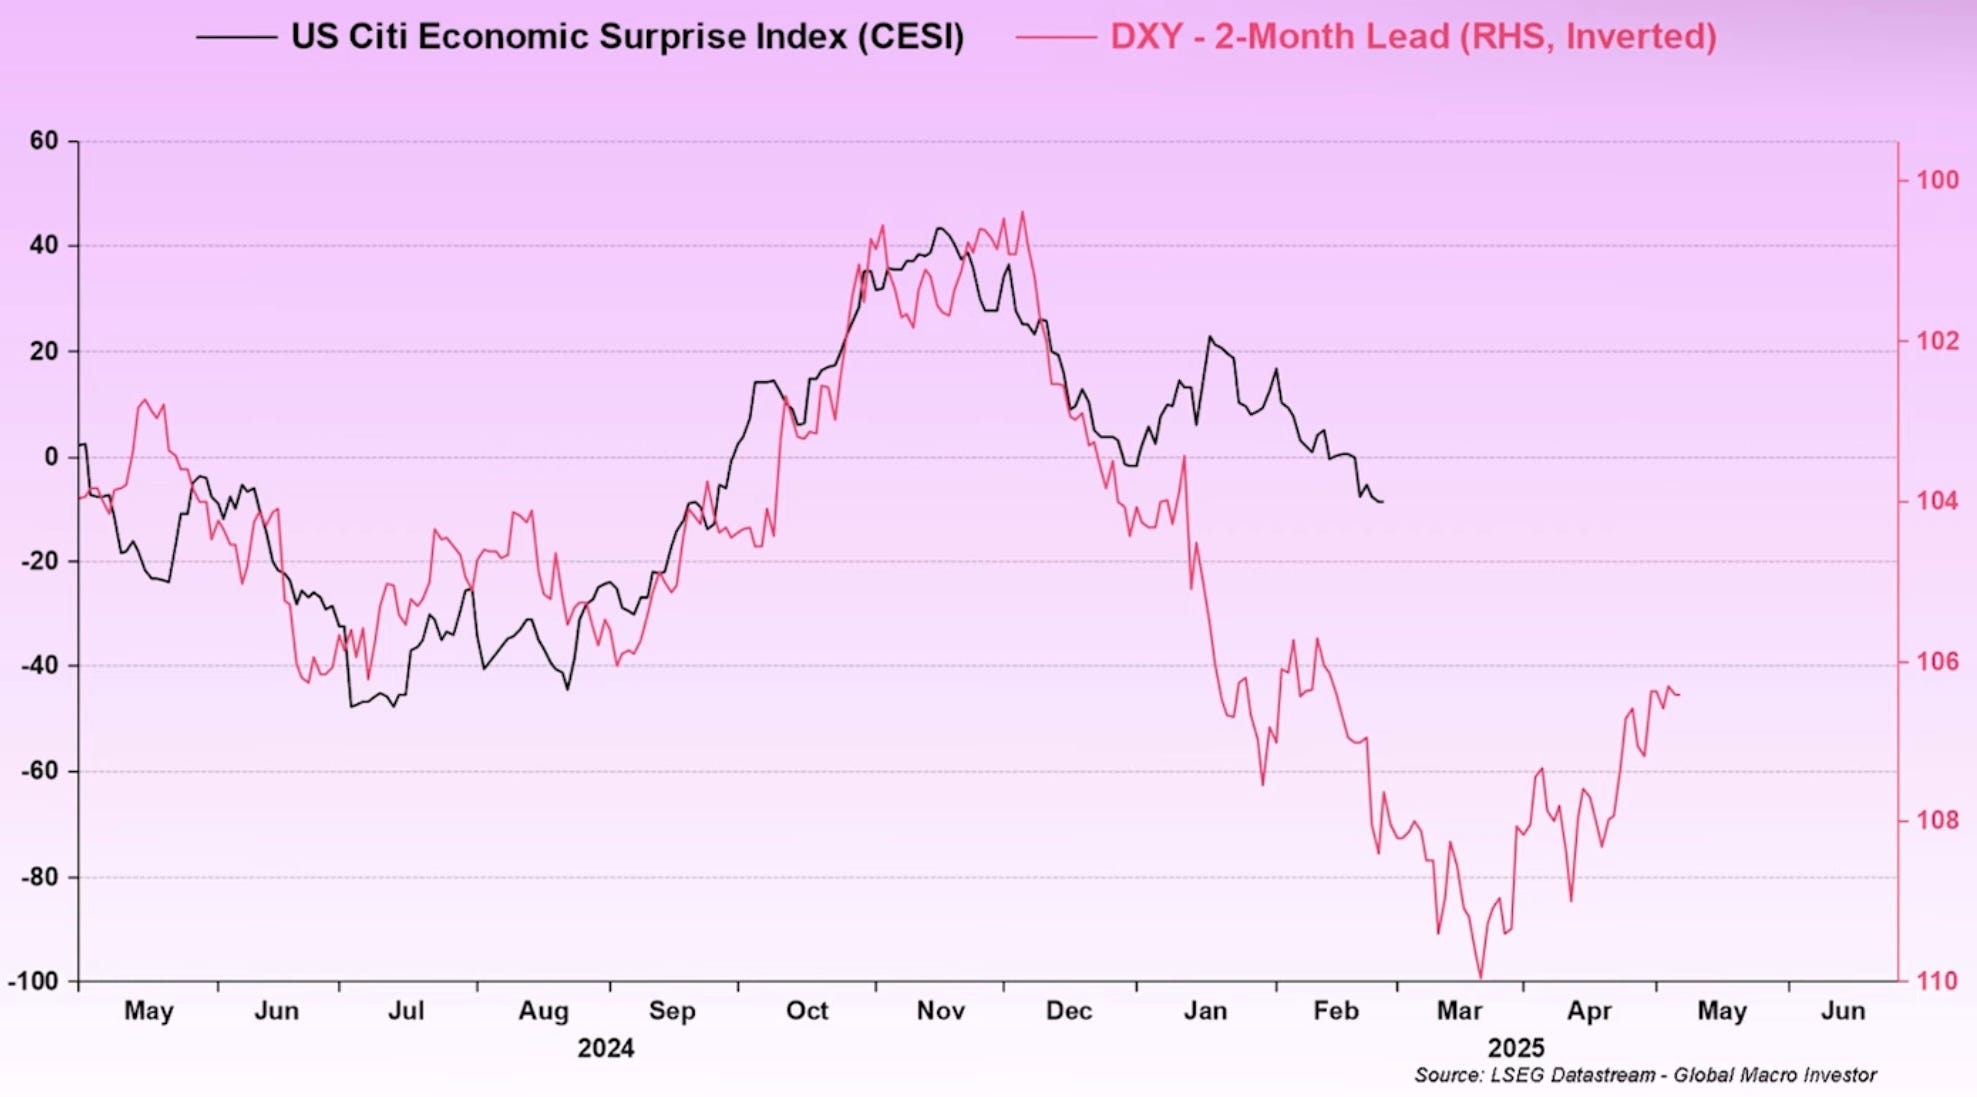
I believe the tightening of financial conditions since the Federal Reserve's 50bps rate cut in September—evidenced by the rise in US 10-year yields from 3.60% to 4.80% and the US Dollar Index climbing from 100 to 110—is finally impacting the real economy. Historical lead-lag relationships, such as the Citi Economic Surprise Index versus the US Dollar Index, support this view and suggest that economic data in the coming weeks may underwhelm expectations.
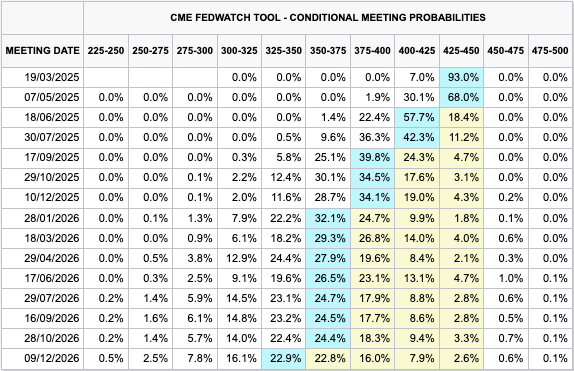
The bond market is currently pricing in four rate cuts between now and December 2026 (see table below). If a slowdown in growth leads to softer inflation prints in the coming months, an additional one to two cuts could be priced into the short end. If the Federal Reserve lowers the effective fed funds rate from 4.33% to 3.08% (a total of five cuts) and core PCE approaches 2.00% within 12–18 months, the Fed would likely consider its policy stance neutral. This remains my base case.
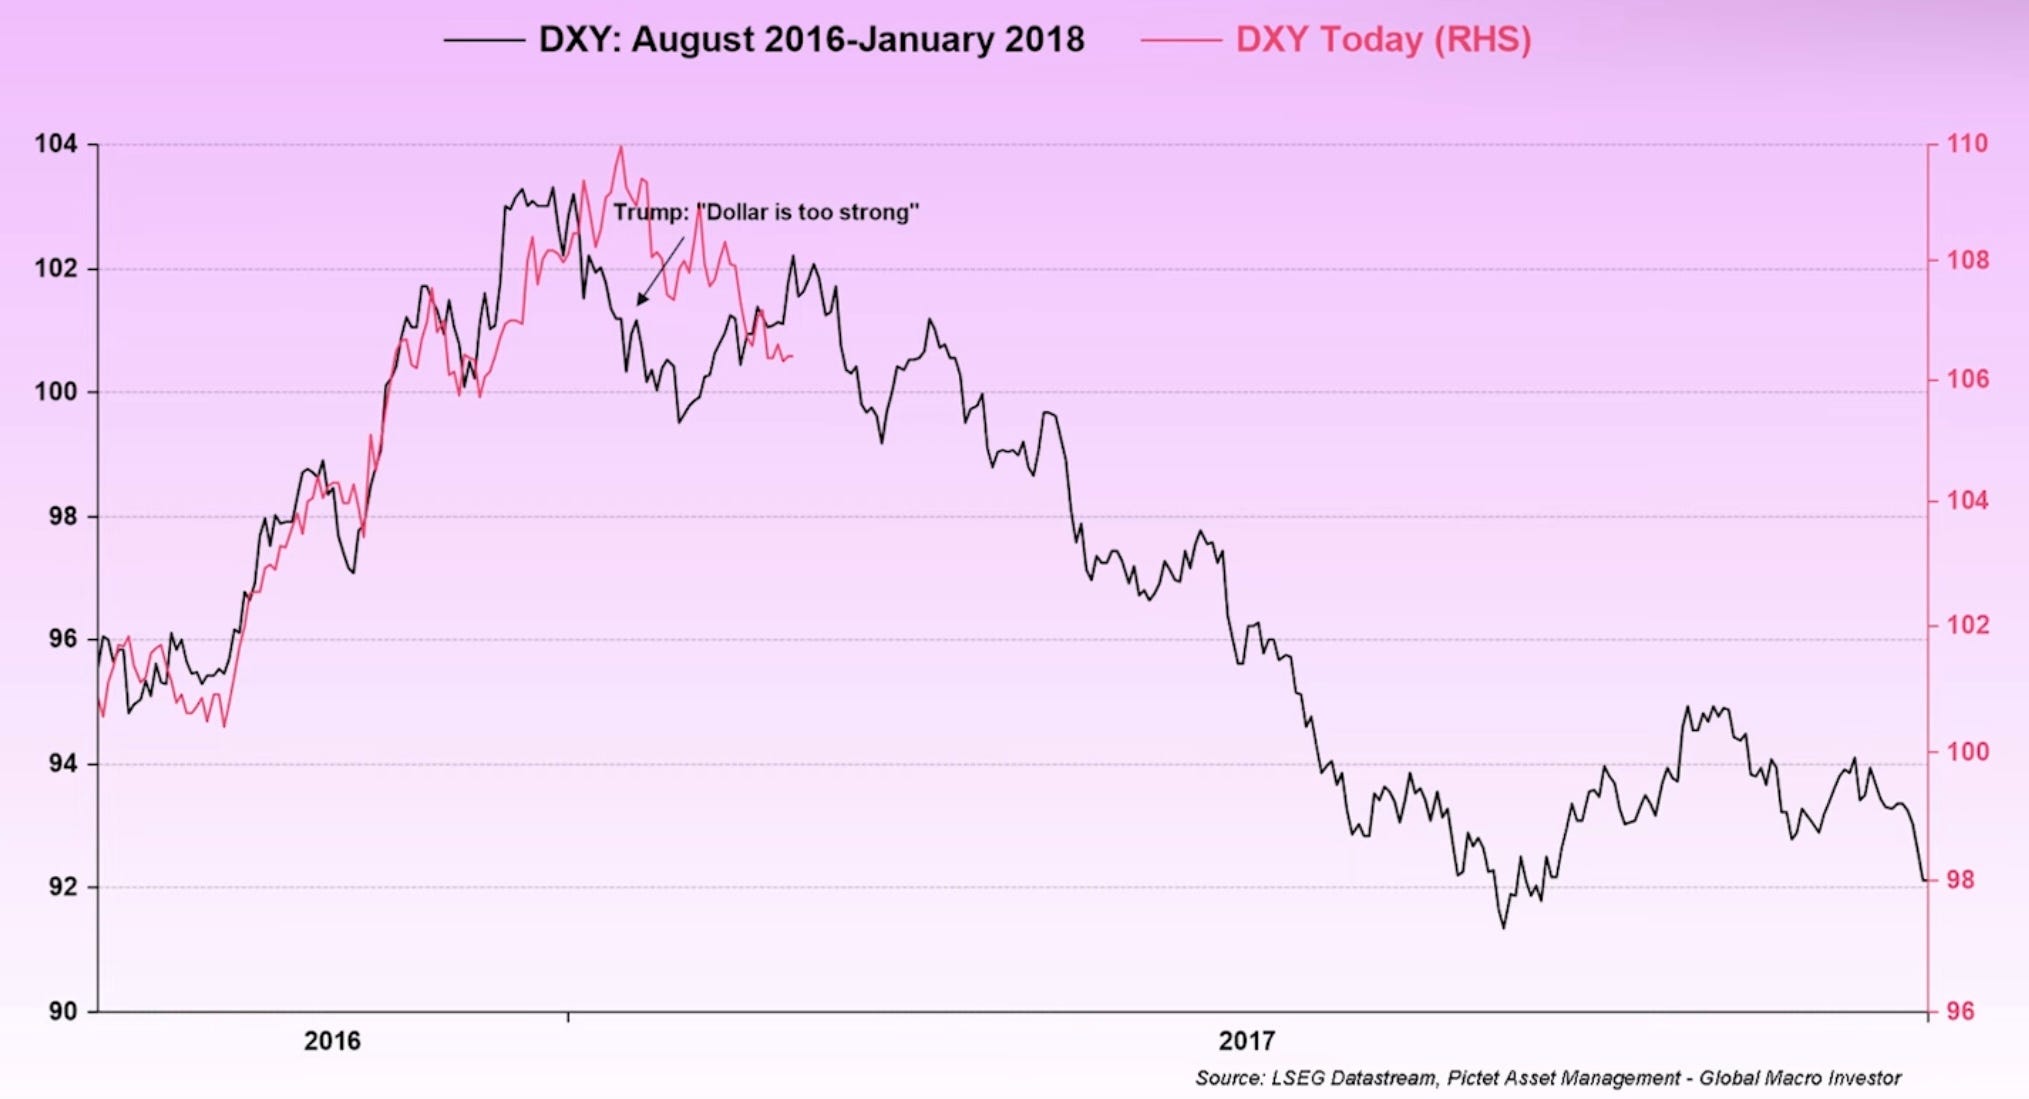
I interpret the strong US dollar as the market front-running the impact of tariffs, Trump's presidency, and US exceptionalism. Long USD was one of the most crowded macro trades a few weeks ago. However, if the 2016–2018 pattern repeats, the US dollar should weaken from here. The administration's push for lower 10-year yields supports this view. Narrower yield differentials could put pressure on the USD over the next 12 months.
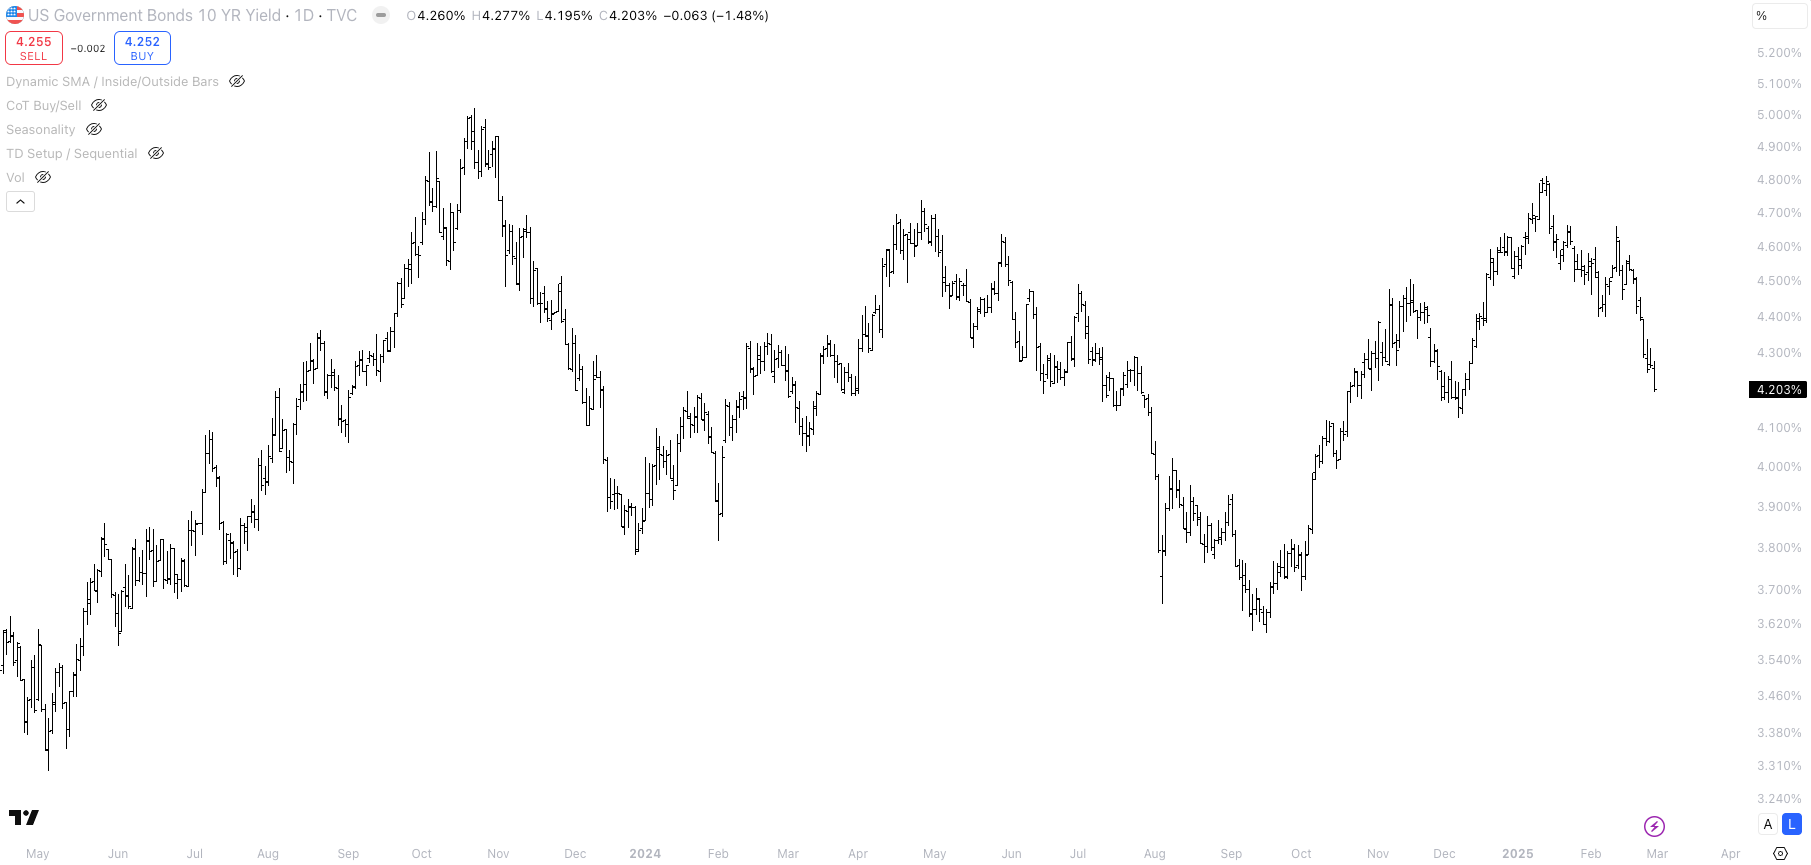
Next week’s NFP prints will be interesting. Elon Musk’s goal is to cut $4 billion in daily spending until September. To achieve this goal, DOGE plans to lay off 300-400k federal workers plus 600-800k contractors. With monthly NFP gains of 150,000–160,000, the unemployment rate would remain stable. However, government layoffs introduce a major risk to NFPs and more broadly economic growth. While the bond market is already pricing in an economic slowdown, I believe there is still room for the momentum to continue and 10y yields to fall further (see chart below).
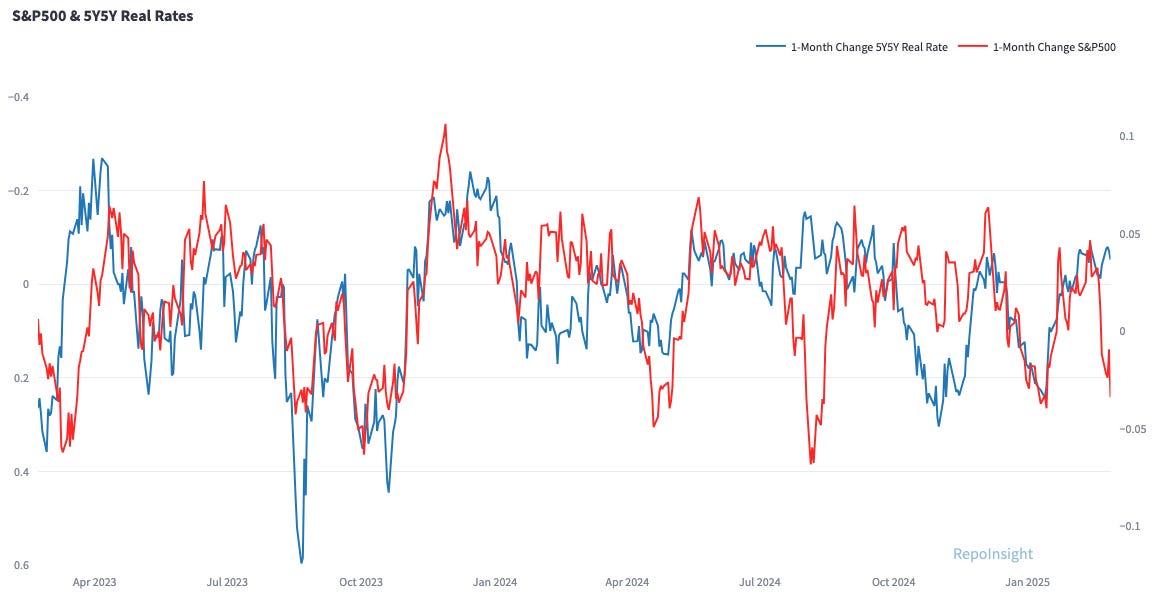
Enough about rates and FX. Let’s take a look at equities. In my opinion, the two main risks for equities are 1) high valuations and 2) elevated earnings expectations. If the economy slows down, earnings could disappoint, which would then make valuations look even higher. The S&P500 selloff last week was not caused by higher real yields. In fact, real yields dropped because they priced in slower economic growth in the future (see chart below).
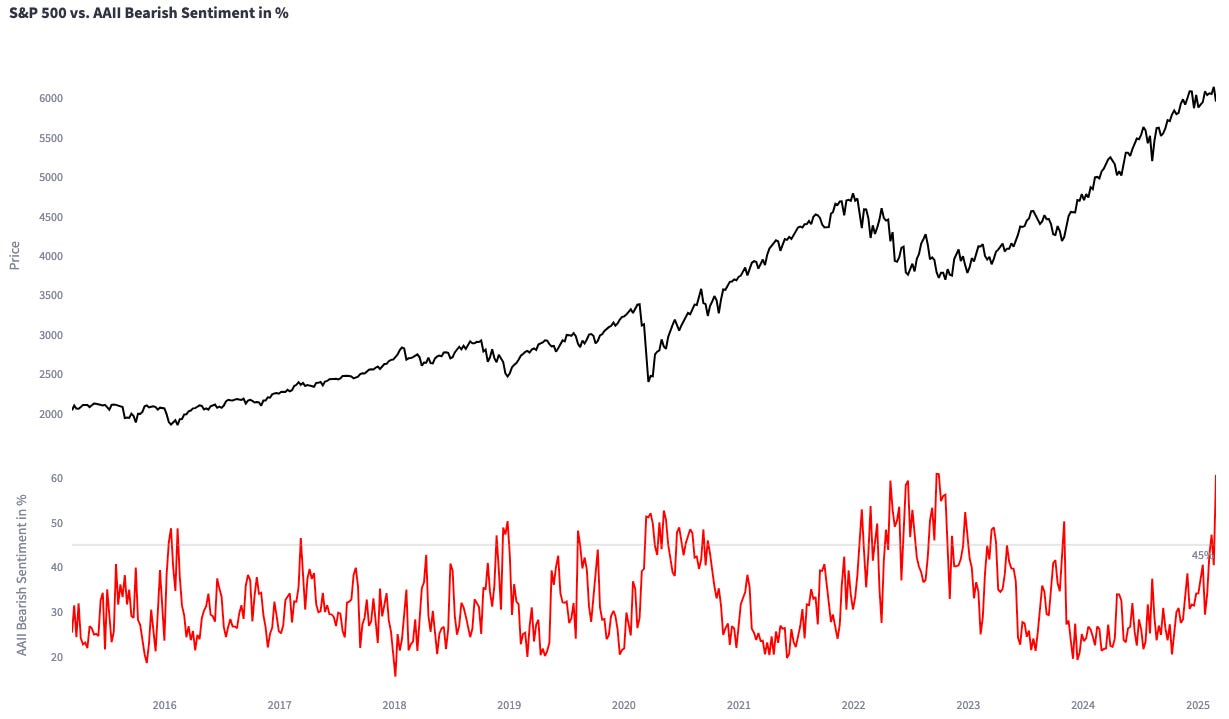
Retail investor sentiment hit a 1-year bearish high. According to the AAII retail investor sentiment survey, 60.8% of all retail investors are currently bearish on the stock market over the next six months. We typically see these kinds of readings when the stock market sold off >10% and we are near a bottom. Can the market sell off much more with this many investors bearish?
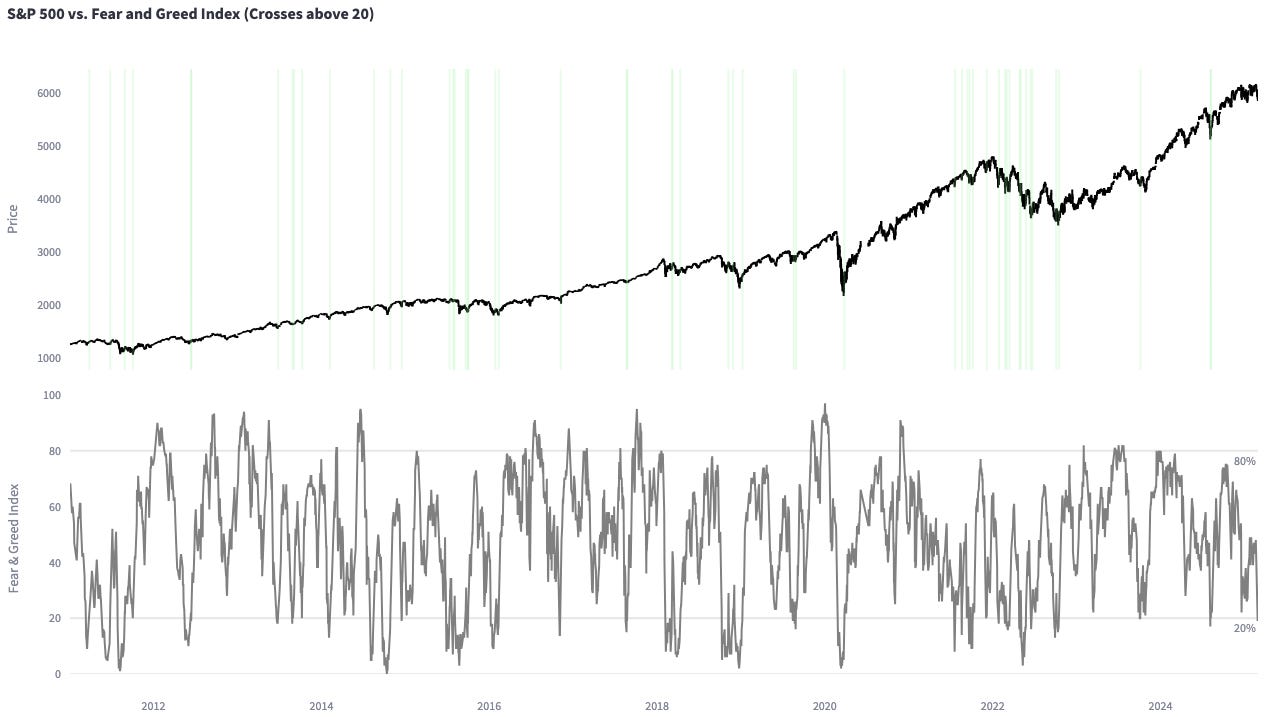
Other sentiment readings, such as the Fear & Greed Index, are close to triggering tactical buy signals. The most recent print was at 19. Historically, when the Fear & Greed Index crosses above 20, it tends to be a good short-term buying opportunity.
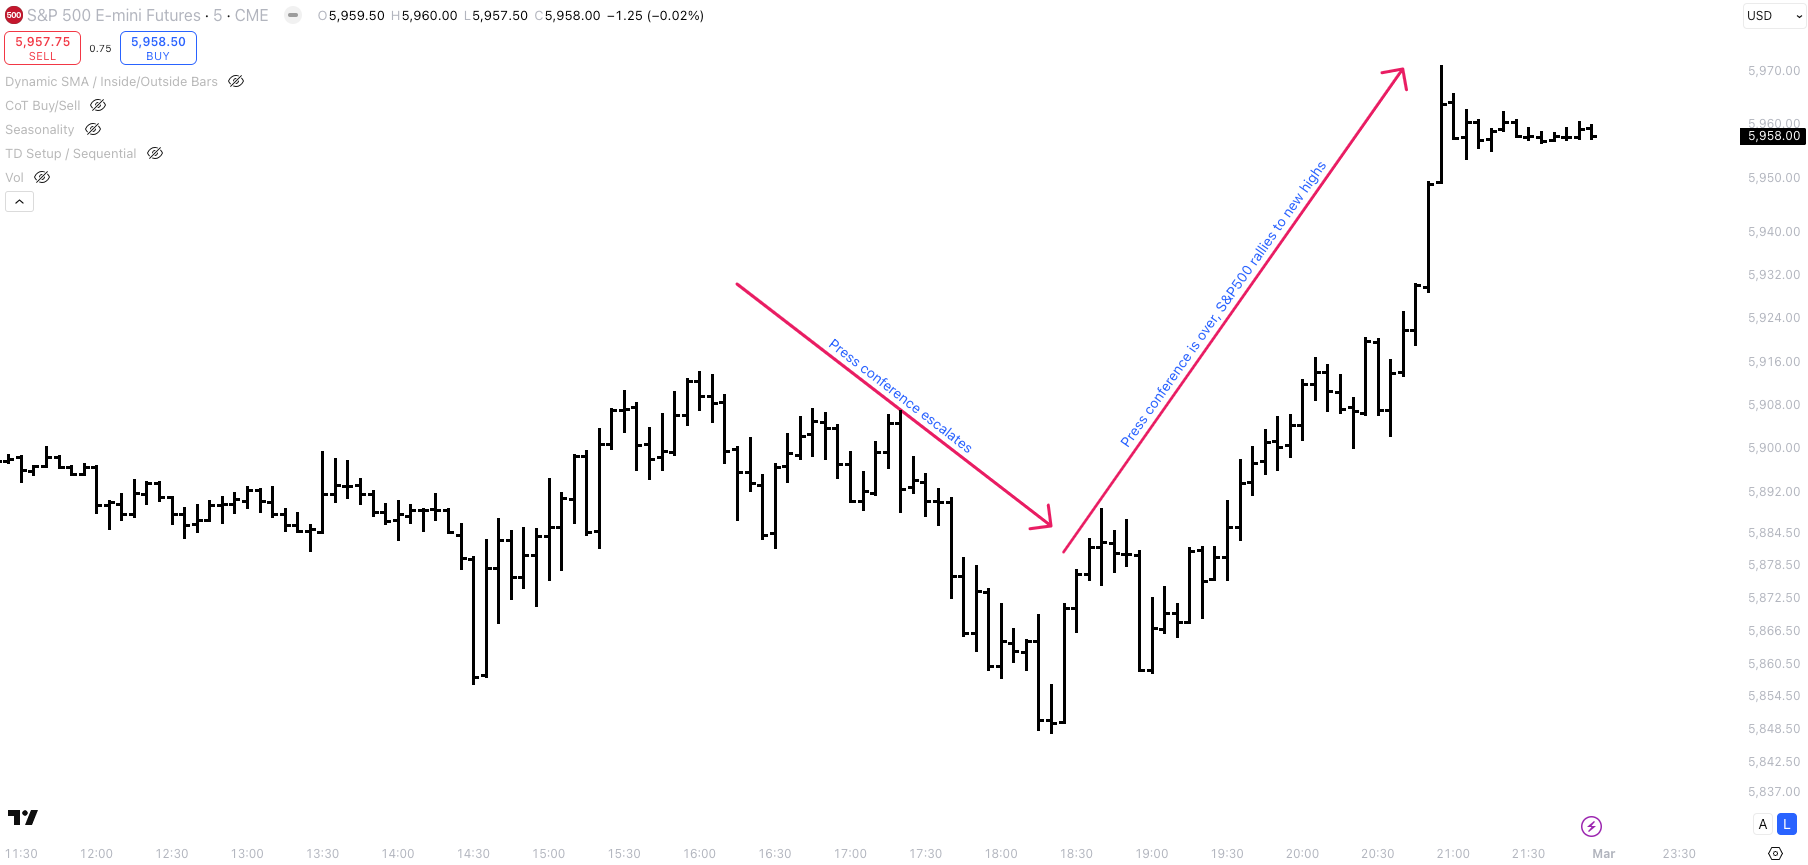
The S&P500’s price action on Friday was bullish. Initially, the S&P500 sold off because the press conference between Zelensky, Trump and Vance became more and more heated, but then it rebounded strongly and closed up +1.48%. The below 5min chart of the S&P500 shows the intraday price action.
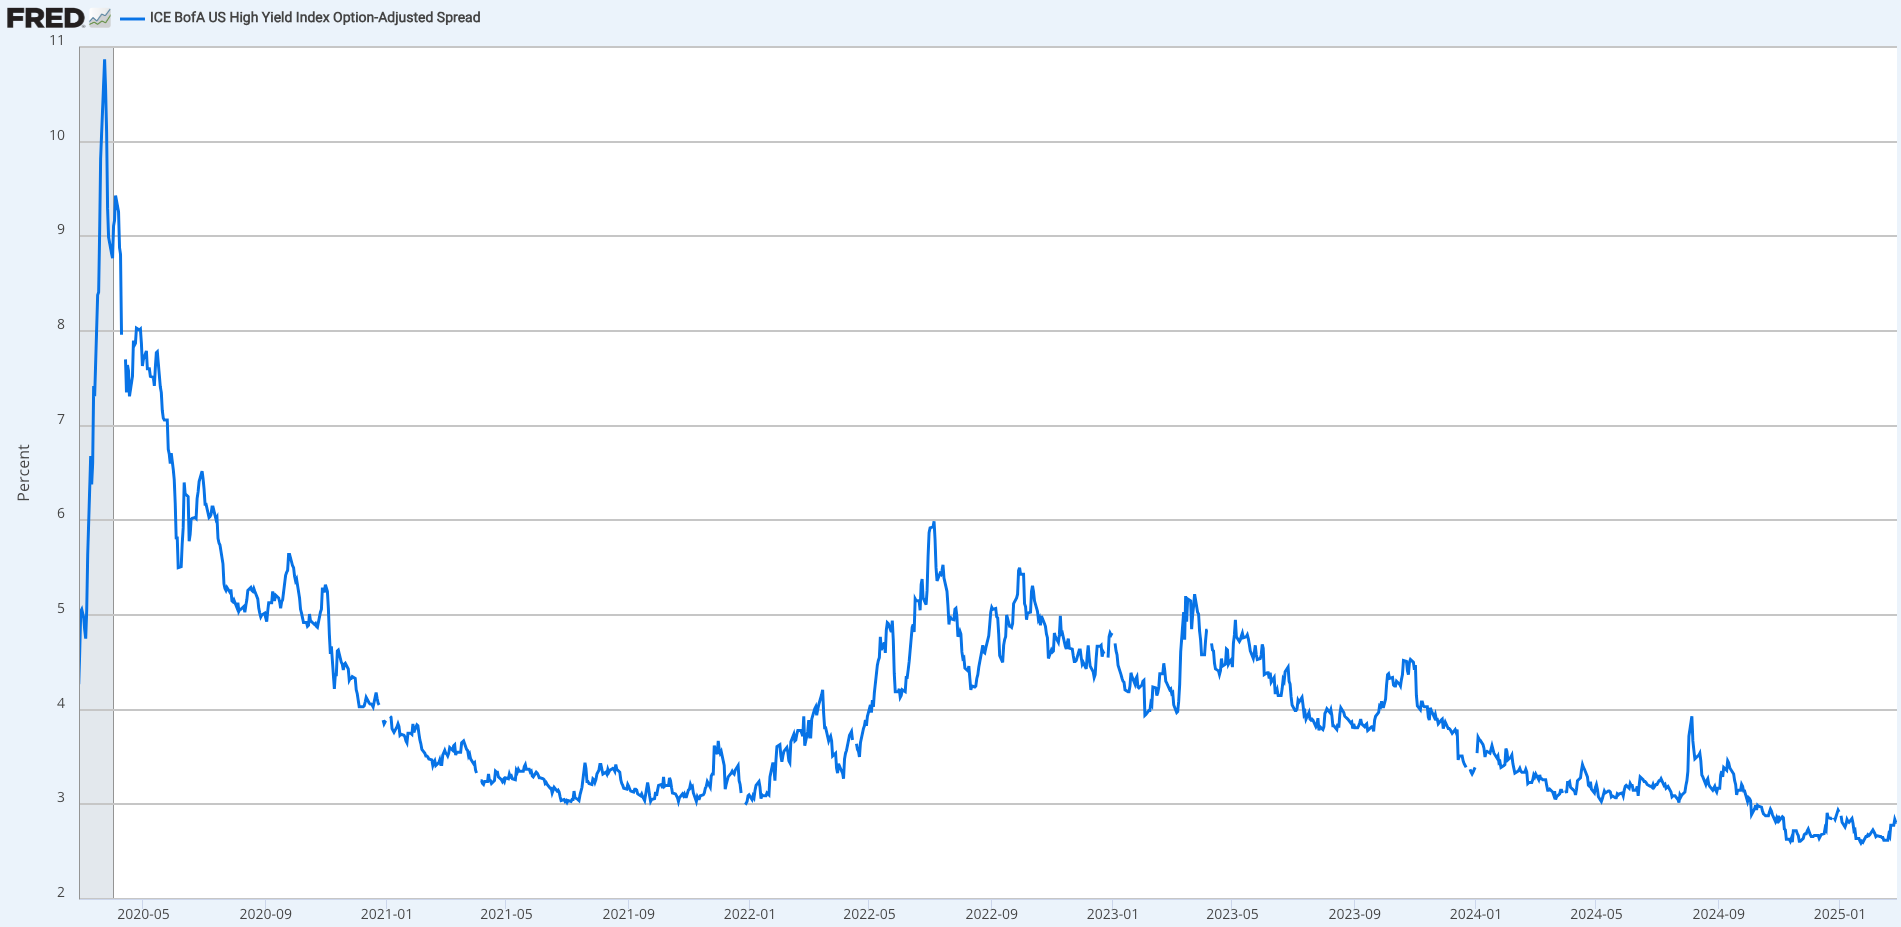
The selloff in the S&P500 was probably 25% a growth scare and 75% a momentum unwind. In a growth scare, credit spreads increase while bond yields fall. This was not the case last week. Credit spreads (see chart below) are still close to all-time lows.
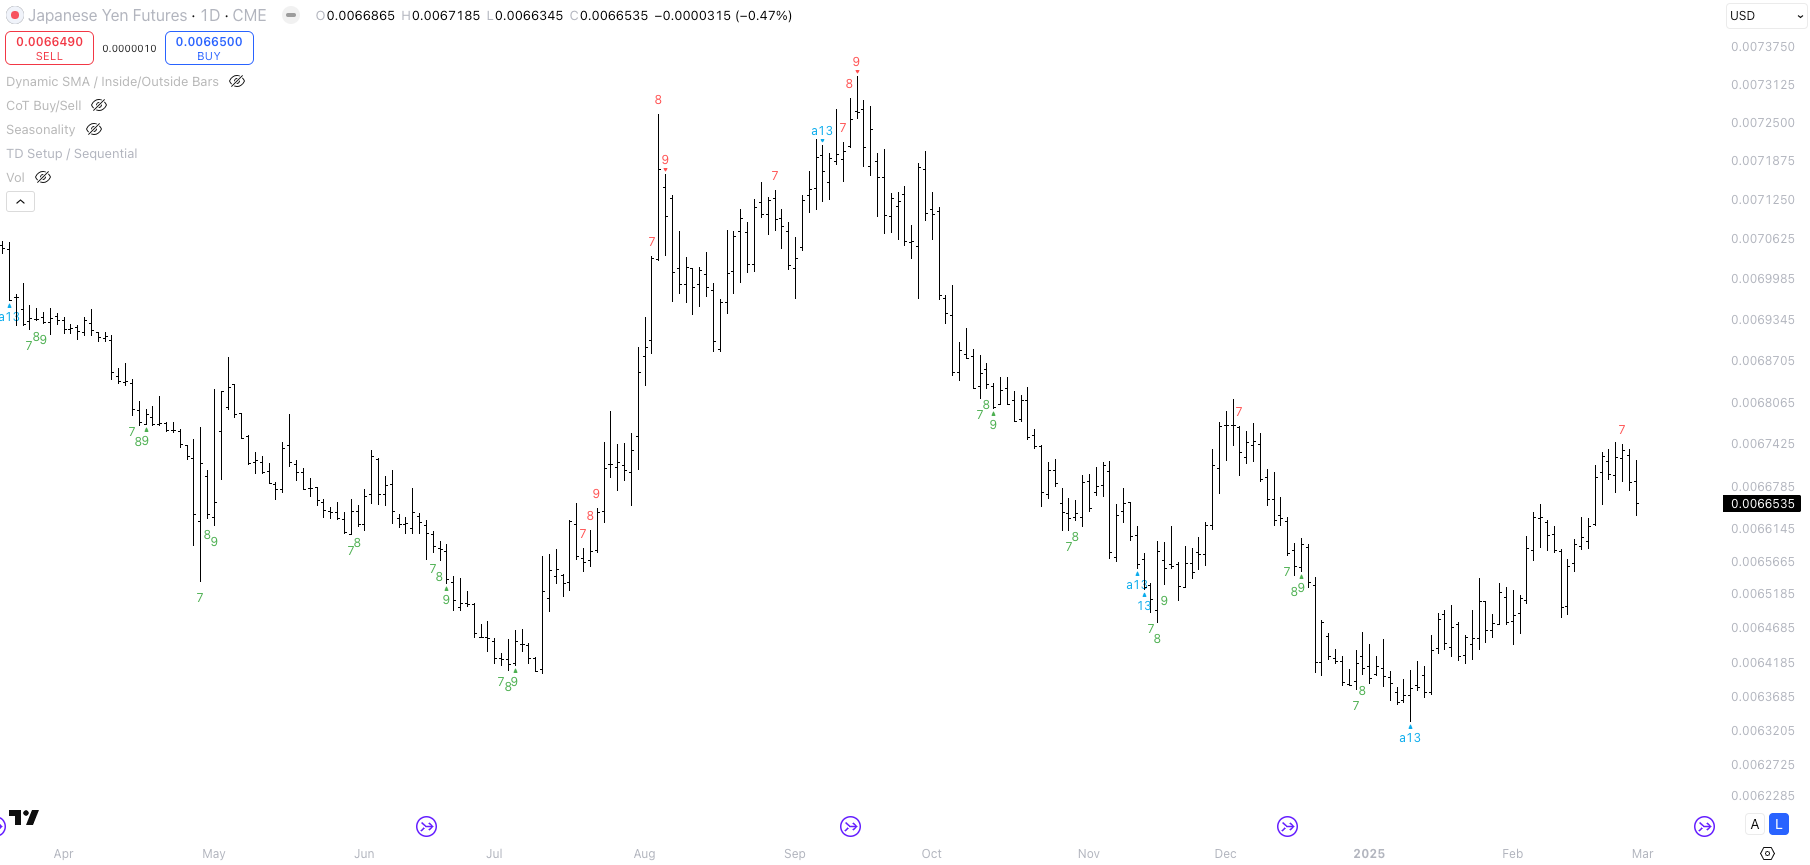
I still lean bullish the short-end, bearish the US dollar and bullish equities. As a new trade idea, I am monitoring JPY. I think long JPY is a consensus and crowded macro trade right now. The BoJ hiking rates and inflation running at 4.0% makes it easy to argue for wider yield differentials and a stronger JPY. The problem is everyone knows this. I am looking for bullish JPY news, but JPY selling off. Then I might open a short JPY position.
I hope you enjoyed this article. I am writing about my views and trade ideas every weekend. Subscribe, so you do not miss the next article - it is 100% free.