
A Cooling Labor Market, the Structural Euro Short, and the Equity Pullback
This week’s article covers the cooling labor market, the QRA, Canadian employment data, and the structural bear case for the Euro — along with what’s driving the latest equity weakness.

Dear readers,
It’s a fascinating time to be a global macro investor. Inflationary pressures are lingering, debt levels around the world are stretched, and geopolitical tensions remain high. At the same time, we’re seeing major central banks experiment with new approaches to monetary policy.
QE has failed to stimulate meaningful economic growth - and central bankers know that now. But if QE no longer serves that purpose, and banking regulation continues to demand ever-larger reserve buffers (think LCR ratios, etc.), the question becomes: how do central banks provide the necessary reserves to the system?
That’s where policy frameworks will begin to diverge over the coming decade. The Federal Reserve continues to operate a supply-driven framework, estimating the least comfortable level of reserves and supplying them via the Standing Repo Facility (SRF) and QE - or “reserve management”.
In contrast, the Bank of England and the European Central Bank are moving toward demand-driven frameworks, where reserves are provided primarily through repo operations. That means less QE - no large-scale bond buying - and more repo facilities such as the BoE’s STR or the ECB’s MRO.
What does this mean? The central bank footprint in global bond markets - not in repo markets - could shrink over the next decade. In other words, the private sector will increasingly have to absorb bond supply, while central banks focus on ensuring there’s enough liquidity to fund it.
The price-insensitive buyer of bonds - central banks - will become less active, while the price-sensitive buyer - the private sector - will have to step in, at least to some degree.
For macro investors, this is exciting. It could mean greater volatility in bond markets, and perhaps even a renewed sense of independence between governments and central banks, as the latter step back from funding public deficits via QE.
With that long-term thought on the evolution of monetary policy, let’s dive into this week’s article.
U.S. Economic Data - Gradual Cooling of the Labor Market
We had a wave of U.S. economic data this week - let’s review.
The ISM Manufacturing PMI came in weaker than expected (48.7 vs. 49.5), with new orders (49.6) and employment (46.0) still in contraction territory.
On the other hand, the ISM Services PMI surprised to the upside (52.4 vs. 50.8), driven by stronger new orders (56.2 vs. 51.0) and less contractionary employment (48.2 vs. 47.6).
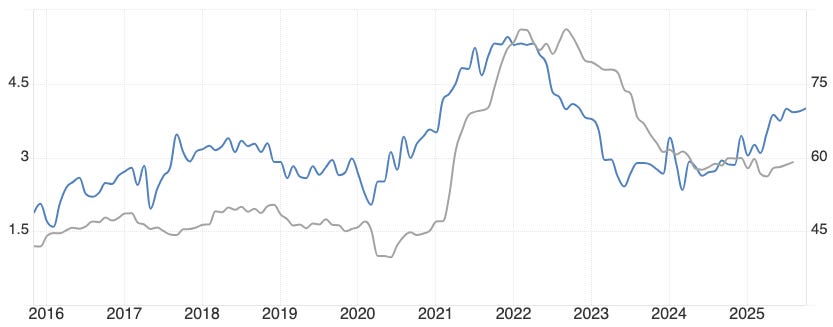
The concern in the Services report is the prices paid component, which remains elevated (70.0 vs. 68.0). Back in 2022, this series (blue) was a solid leading indicator for core PCE (grey) - suggesting that services inflation pressures remain sticky.
The ADP report showed private job growth of +42k (BBG consensus: +30k; Kalshi consensus: +36k), consistent with the theme of a gradually cooling labor market rather than a sharp slowdown.
According to Revelio Labs, nonfarm employment fell by 9k in October - a decline driven by government job losses offsetting small private sector gains.
There’s also been a rise in job cut announcements recently. While headline layoffs can sound alarming, it’s worth remembering that roughly 1.7 million layoffs occur each month in the U.S.
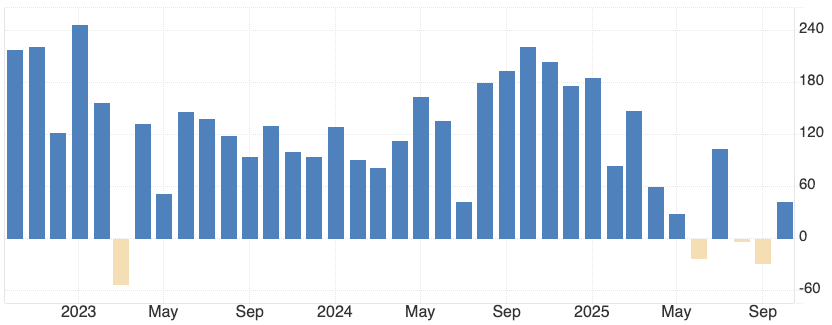
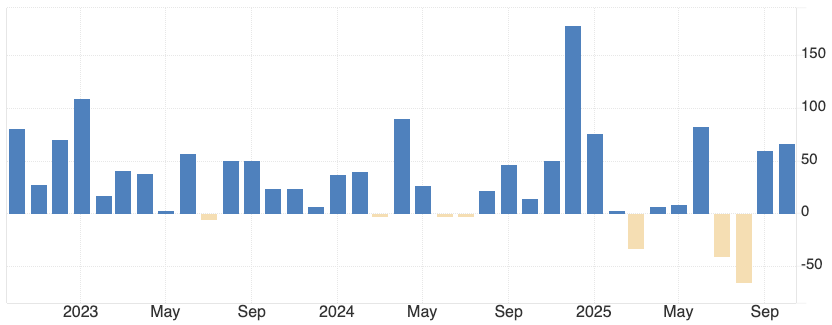
Still, this time the announcements seem meaningful - as Warren Pies’ chart on Challenger net hiring (hiring plans minus job cuts) shows, labor demand looks materially weaker than in prior years.

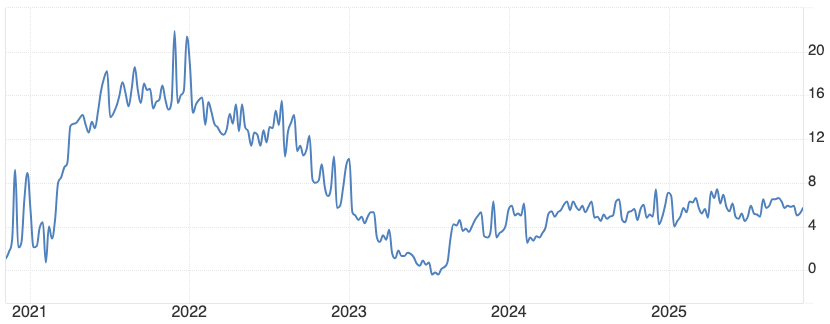
A softer labor market also implies slower income growth, which we’re starting to see in federal employment tax receipts. The latest print of +3.4% marks a notable slowdown.

This gradual cooling is something to watch. If the labor market eventually rolls over and aggregate incomes stagnate, consumption will weaken. So far, that hasn’t happened - but the risks are rising.
The Redbook Index, a timely gauge of retail sales, held steady at +5.7% YoY this week. As long as employment remains stable, I expect consumption to remain resilient as well.
We also had the Quarterly Refunding Announcement (QRA) this week. As expected, the Treasury kept coupon auction sizes unchanged, but noted:
„Treasury has begun to preliminarily consider future increases to nominal coupon and FRN auction sizes, with a focus on evaluating trends in structural demand and assessing potential costs and risks of various issuance profiles.“
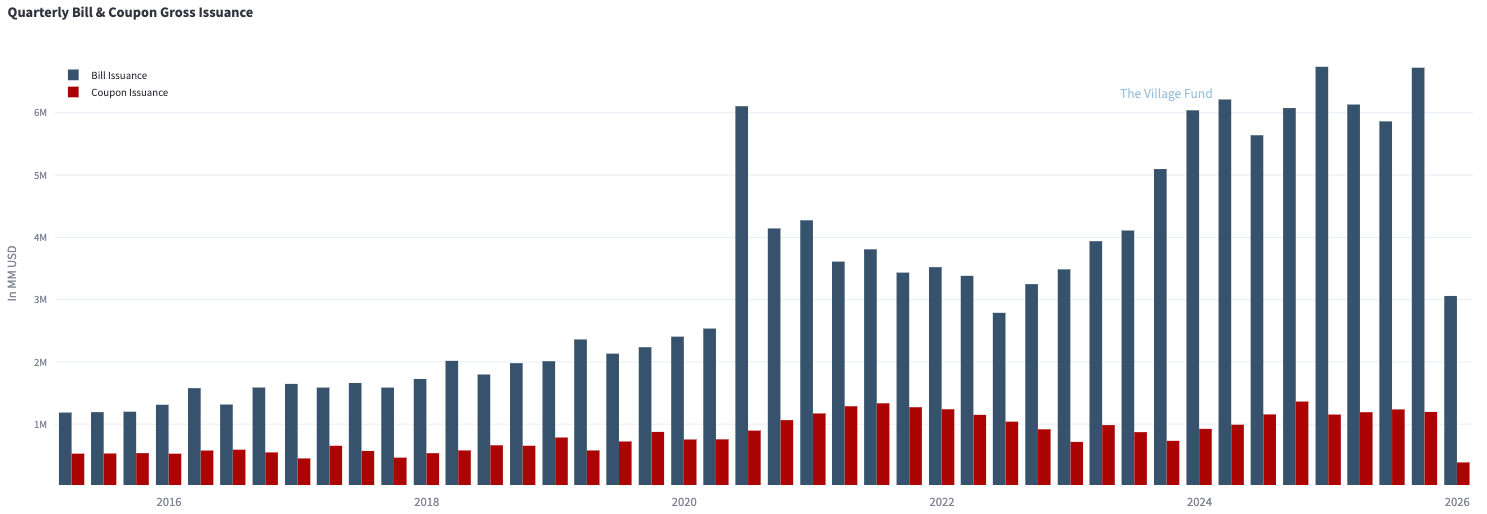
At some point, the Treasury will have to increase coupon auction sizes and reduce bill issuance. Year-to-date, total issuance stands at $1.54 trillion, of which $850 billion are bills and only $204 billion are coupons.
If this trend continues, the Treasury’s debt profile would become heavily bill-dependent - bills currently account for roughly 21% of total outstanding debt. The math makes it clear: more coupon issuance is inevitable.
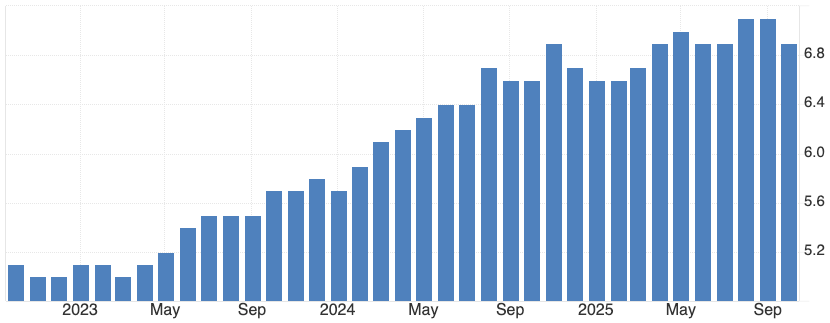
The chart below shows how total issuance - especially bills - has surged in recent years.
When the Treasury does increase coupon auction sizes, the market will need to absorb more duration. If the Fed adjusts its reinvestment policy toward bills at the same time, that shift could have meaningful implications for bond markets. For now, though, this is a 2026 story.
Summary:
The labor market continues to weaken gradually, but hasn’t rolled over yet.
The consumer remains healthy, with steady consumption growth.
Services inflation remains sticky.
An increase in coupon auction sizes in 2026 looks increasingly likely.
Global Macro Trading - It Is Never Easy
I started the week positioned long U.S. dollars, long Corra Dec’26, and long SOFR Jun’27 versus short SOFR Jun’26. The idea was straightforward: a stronger U.S. dollar against the euro, a softer Canadian economy, and fewer near-term cuts followed by more once Powell leaves the Fed.
My Corra Dec’26 position was relatively small, but as I mentioned last week, I was considering doubling it - which (unfortunately) I did on Monday.
Then came Friday’s Canadian employment data: +66k jobs vs. -5k expected - a big beat.
There is one important caveat, though. Full-time employment fell by 18.5k, while part-time employment rose by 85.1k, which suggests the Canadian economy is still on shaky ground. But with the unemployment rate falling from 7.1% to 6.9%, it’s fair to say it might have peaked for now.
Core inflation in Canada bottomed roughly a year ago and hasn’t softened further, even as the labor market weakened. Friday’s report also showed wage growth accelerating to 4% (vs. 3.5% expected). The last core inflation print of 2.8% remains above target, and we’ll get the next read on Monday, November 17th.
Given this backdrop - a central bank signalling no more cuts, stronger-than-expected employment data, and persistent wage and inflation pressures - I decided to close my Corra Dec’26 position on Friday, taking a ~0.4% loss. I’ll keep monitoring the data; this may turn out to be a temporary blip of strength.
My SOFR spread remains around 3bps in the money. It should continue to work if we see weaker U.S. labor data or a prolonged government shutdown, but I’m keeping it on a tight leash - I don’t want this trade to turn red.
As for the euro, next week’s price action will be key. It tried to rally on Thursday but ran out of steam on Friday. I still expect more downside - and in the next section, I’ll explain why I think the euro should weaken further.
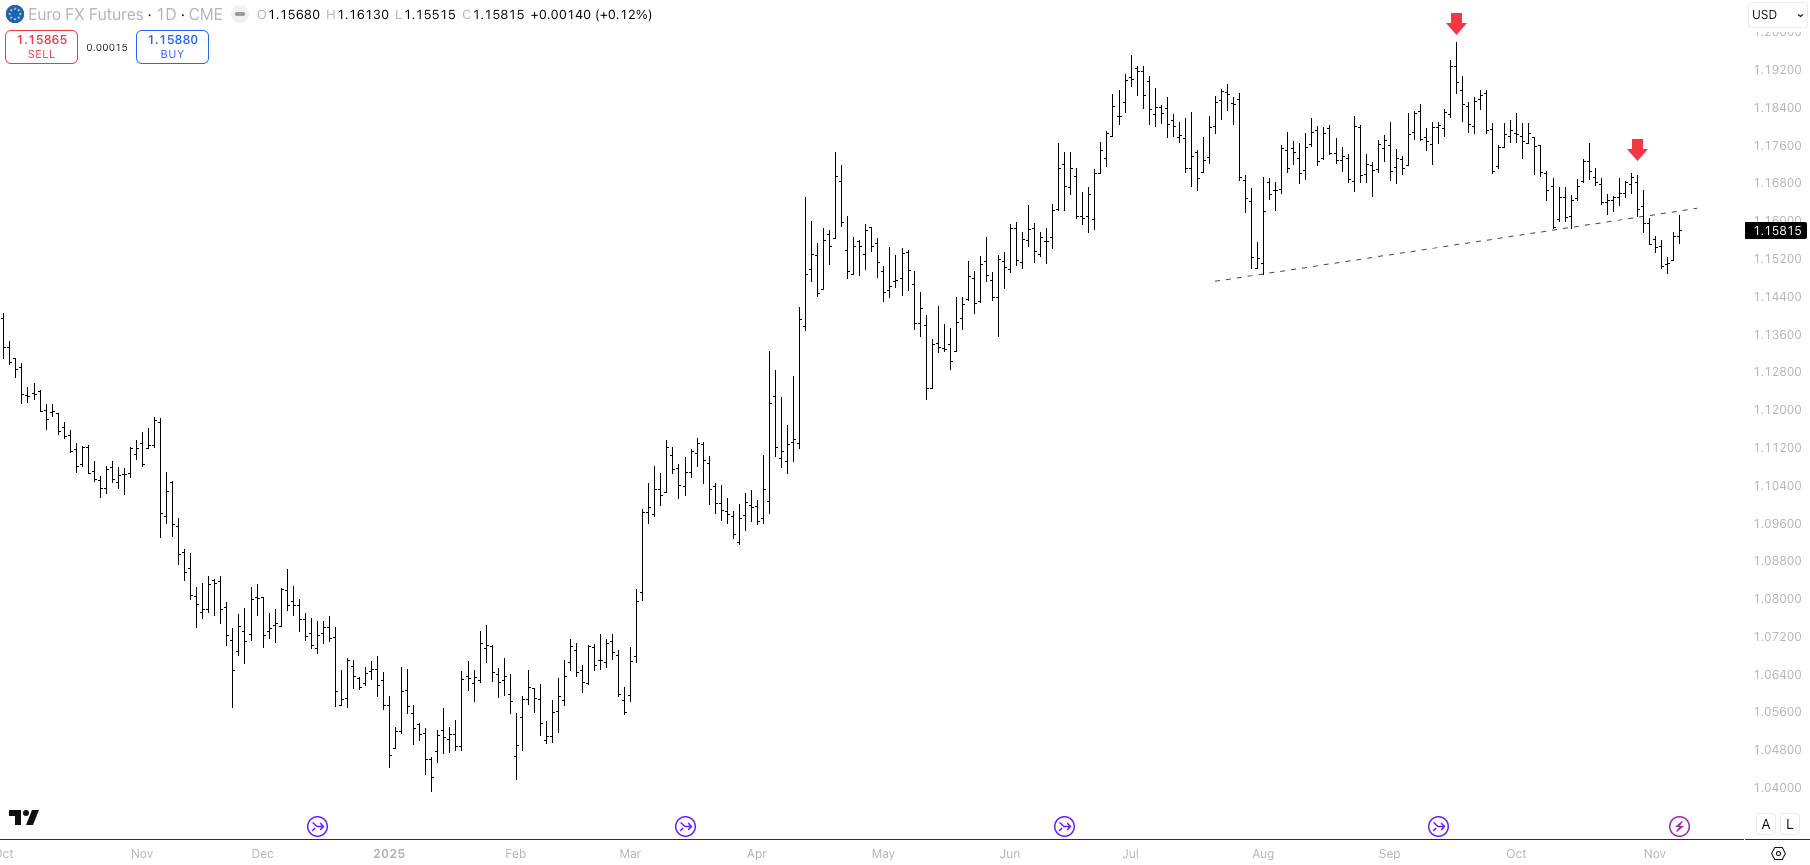
Why I Believe the Euro Is A Structural Short
The main reason for my long-term bearish view on the euro is simple: Germany. Once Europe’s economic powerhouse, it has become the “sick man of Europe.” And I don’t think any other European country - not France, not Italy - will be able to fill that gap.
Unlike most other developed economies, Germany still relies heavily on manufacturing. In 2023, manufacturing made up 18.4% of Germany’s GDP (France: 9.7%, U.S.: 10.3%). Roughly 20% of total employment is in manufacturing, and 11% of those jobs are directly tied to the auto sector. Yet policymakers seem oblivious to how vital this sector is - and their policy choices have been actively damaging.
Germany now has:
The highest household electricity prices in Europe
The highest corporate tax rate among G7 countries
60% more federal legislation (i.e., bureaucracy) than in 2010
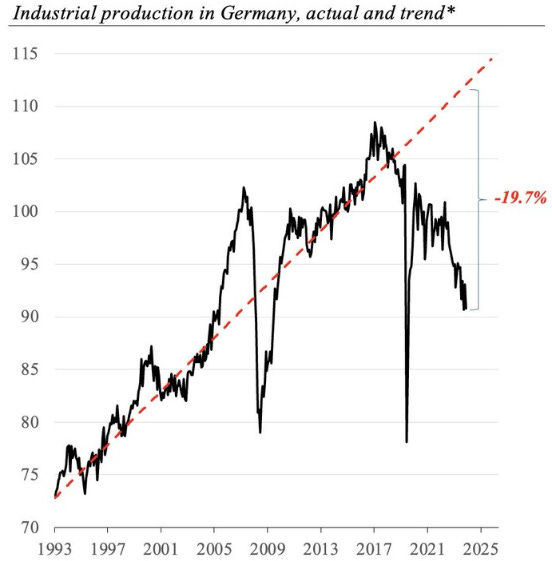
Germany’s industrial base is struggling - industrial production is now running ~20% below trend.
Private investment is falling (blue), government spending keeps rising (red), and GDP has been flat since 2019. That’s more than five years of stagnation.

The divergence between private and public sector activity is striking: the private sector has stopped investing, while the government props up GDP through spending. Fiscal deficits have masked the underlying weakness - but hiring another 10,000 public employees or announcing a new infrastructure plan doesn’t create sustainable output. It’s artificial GDP support.
Germany could change course - lower taxes, cut bureaucracy, restart nuclear, reduce welfare spending, and invest in infrastructure and defense - but it hasn’t. Even the new €500bn fiscal package likely won’t move the needle; much of it will go to plugging budget gaps rather than stimulating private investment.
And Germany isn’t the whole of Europe. France is running deficits near 5% of GDP with debt at 113% of GDP. Italy is worse at 138%. Demographics are another drag:
Italy: 48.4 years
Germany & Spain: 46.8 years
France: 42.6 years
United States: 38.9 years
Europe’s smaller economies — Portugal, Greece, Belgium, the Netherlands — simply aren’t large enough to offset this. Spain is a relative bright spot, but that’s about it.
Politically, Europe’s instinct is clear: when growth stalls, run deficits, and when debt and yields rise, ask the ECB to intervene. Structural reform rarely makes the list. Until that changes, I find it hard to build a structural bull case for the euro. This week’s headline:

None of this calls for a structural bull case for the euro. And sentiment is not bullish the US dollar either. I read this on X this week: “The US dollar is expected to continue to decline,” per Morgan Stanely, $MS.
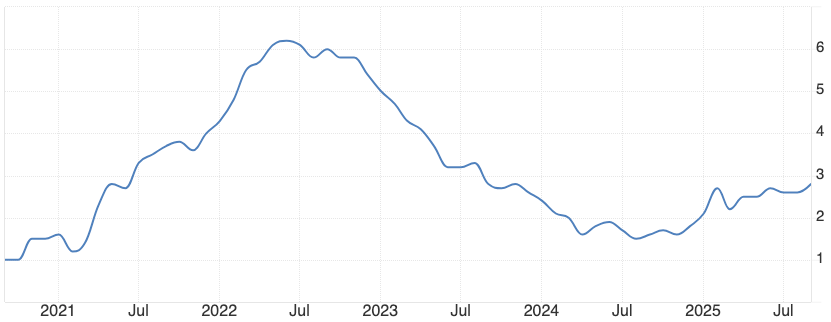
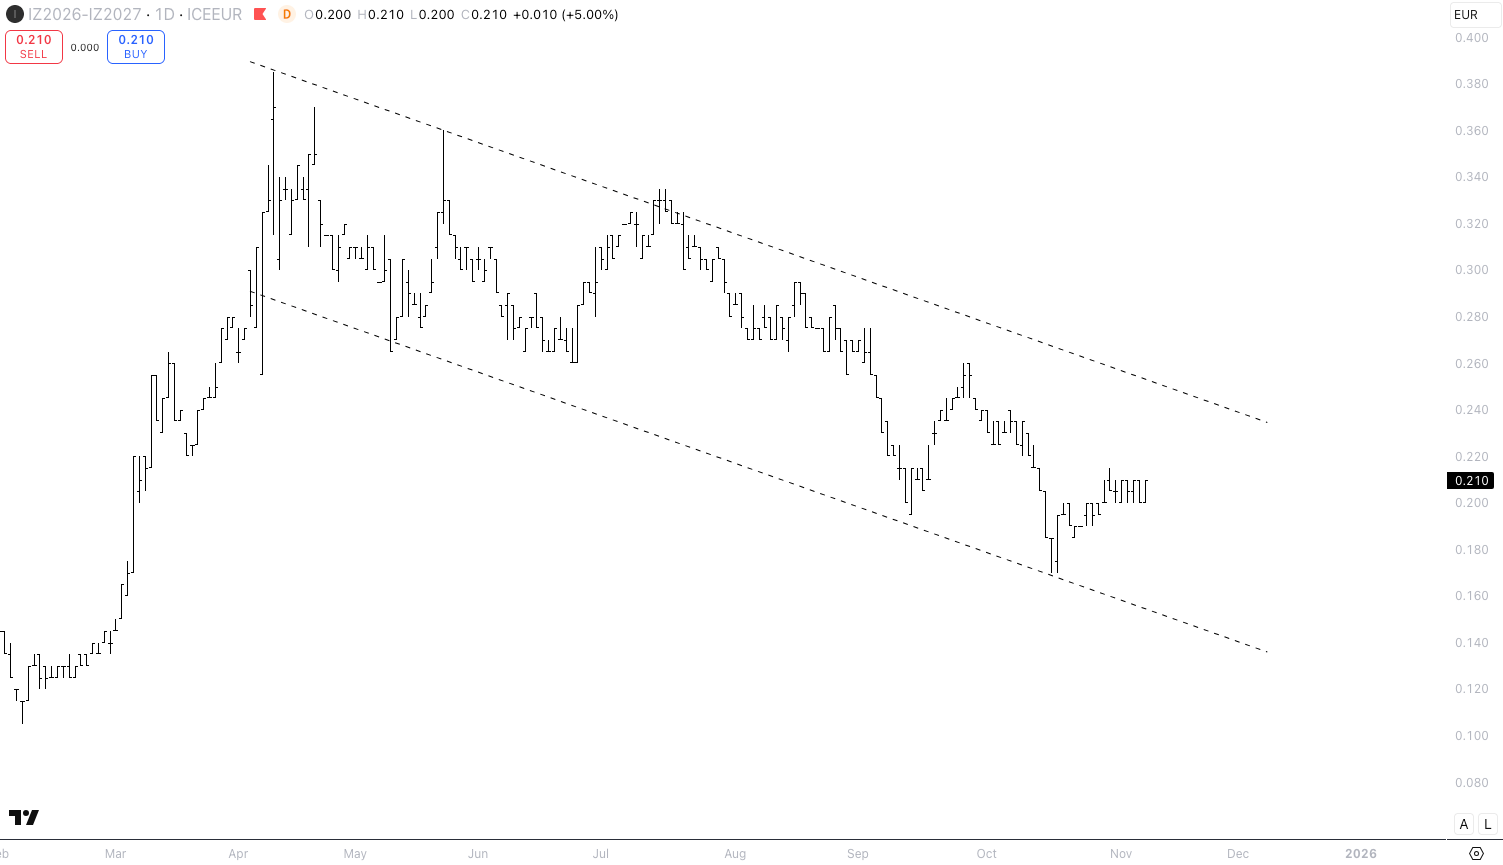
One area worth monitoring is Eurozone inflation. Services inflation remains sticky at 3.4%, and core inflation is still above target at 2.4%. I don’t expect a re-acceleration, but persistent services inflation could delay rate cuts. Chart: here.

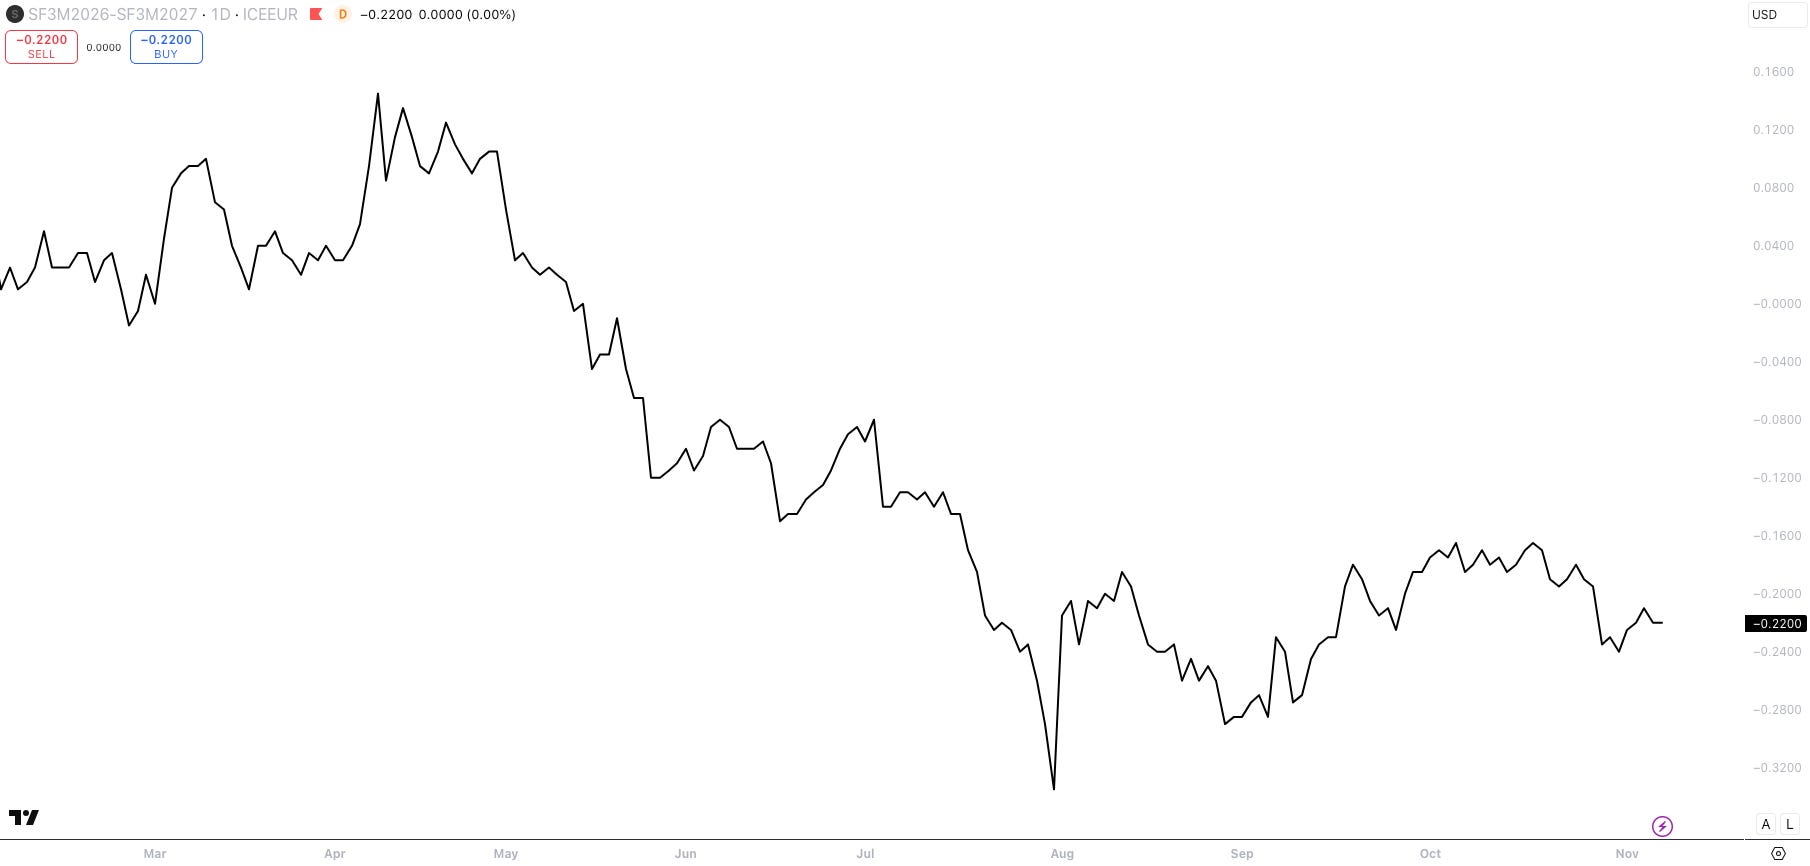
Finally, I’m watching the Euribor Dec’26–Dec’27 spread, which still prices in 20bps of hikes in 2027. If inflation doesn’t re-accelerate and Germany’s fiscal package disappoints, those hikes should be priced out. I haven’t opened a position yet - but it’s on my radar.
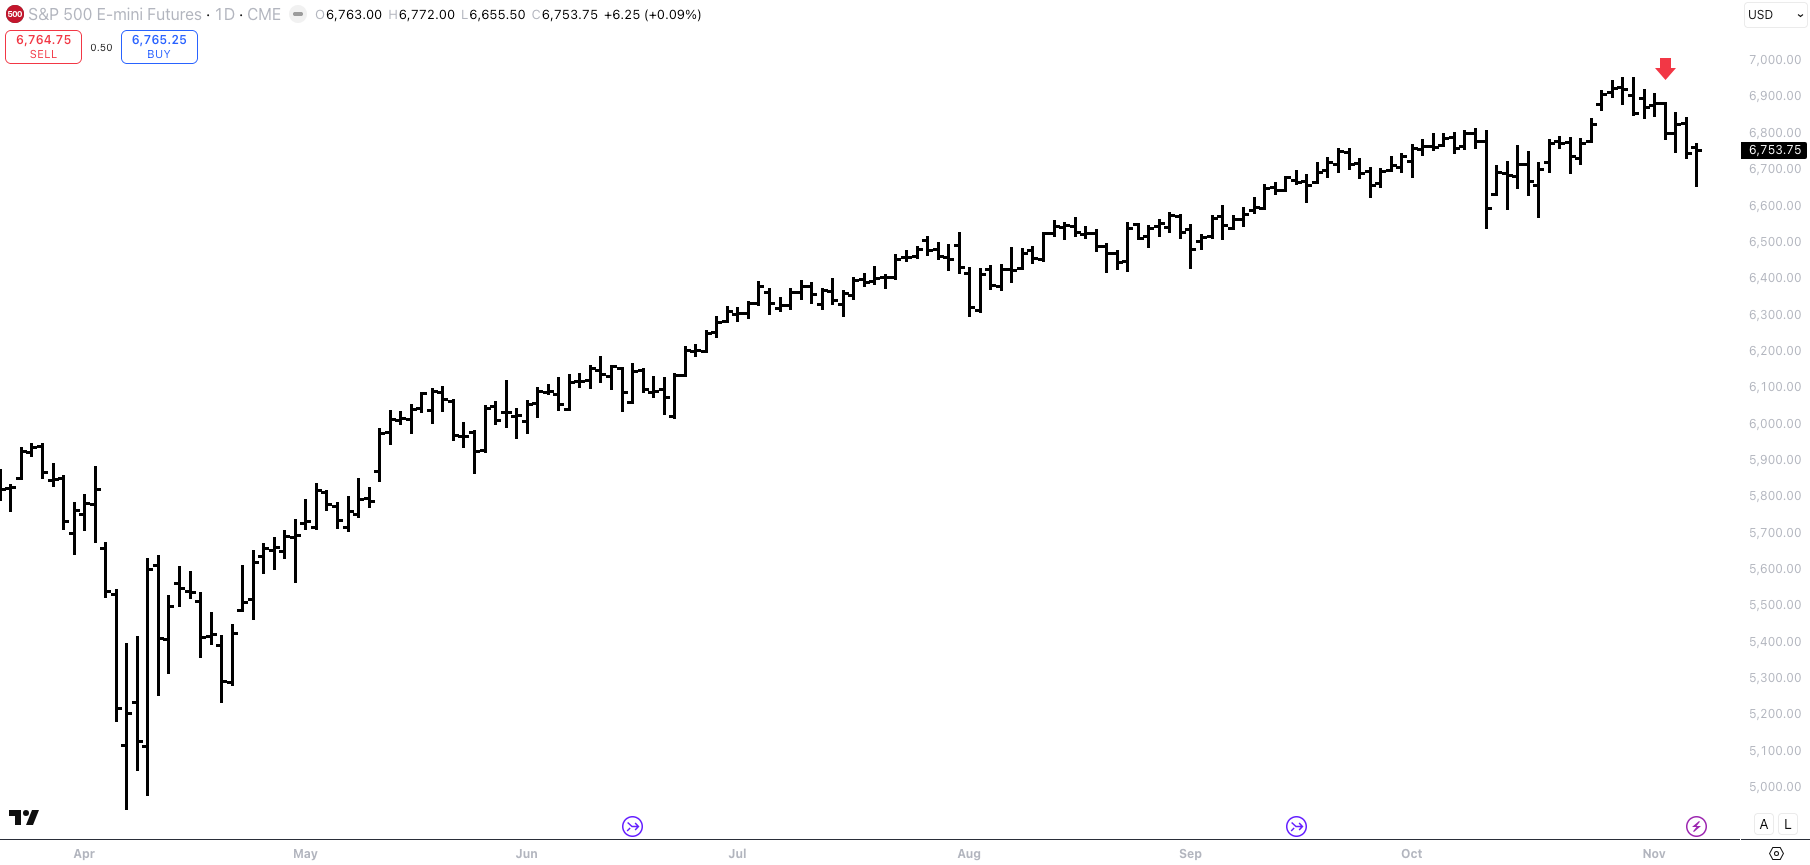
Equities - When AI News Are Fully Priced
The company of the year - Palantir - reported earnings on Monday. Every metric beat expectations, yet the stock is down about 15% since. Even after the selloff, it still trades at a forward P/E of 245x - a reminder of just how stretched valuations in the AI space remain.
By Tuesday, the tape felt heavy (red arrow). Markets no longer seemed impressed by AI headlines. And the next day, November 5th, we saw the third Hindenburg Omen signal - another technical warning worth noting.
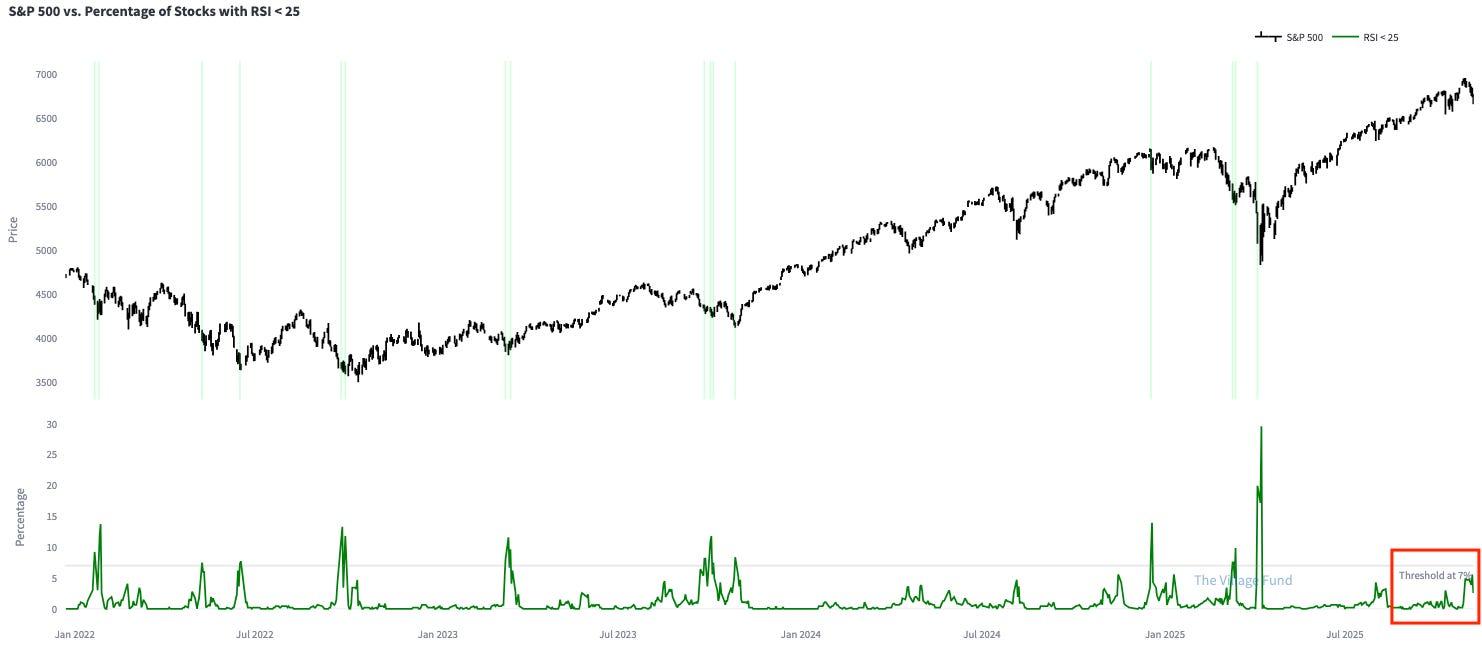
One indicator I continue to track is the number of S&P 500 stocks with RSIs below 25. So far, this hasn’t triggered a buy signal.
As I mentioned last week, I planned to raise cash in my tax-efficient investment account - and I did exactly that on Monday. I’m now sitting at 43% cash, which helped me sidestep much of the recent drawdown.
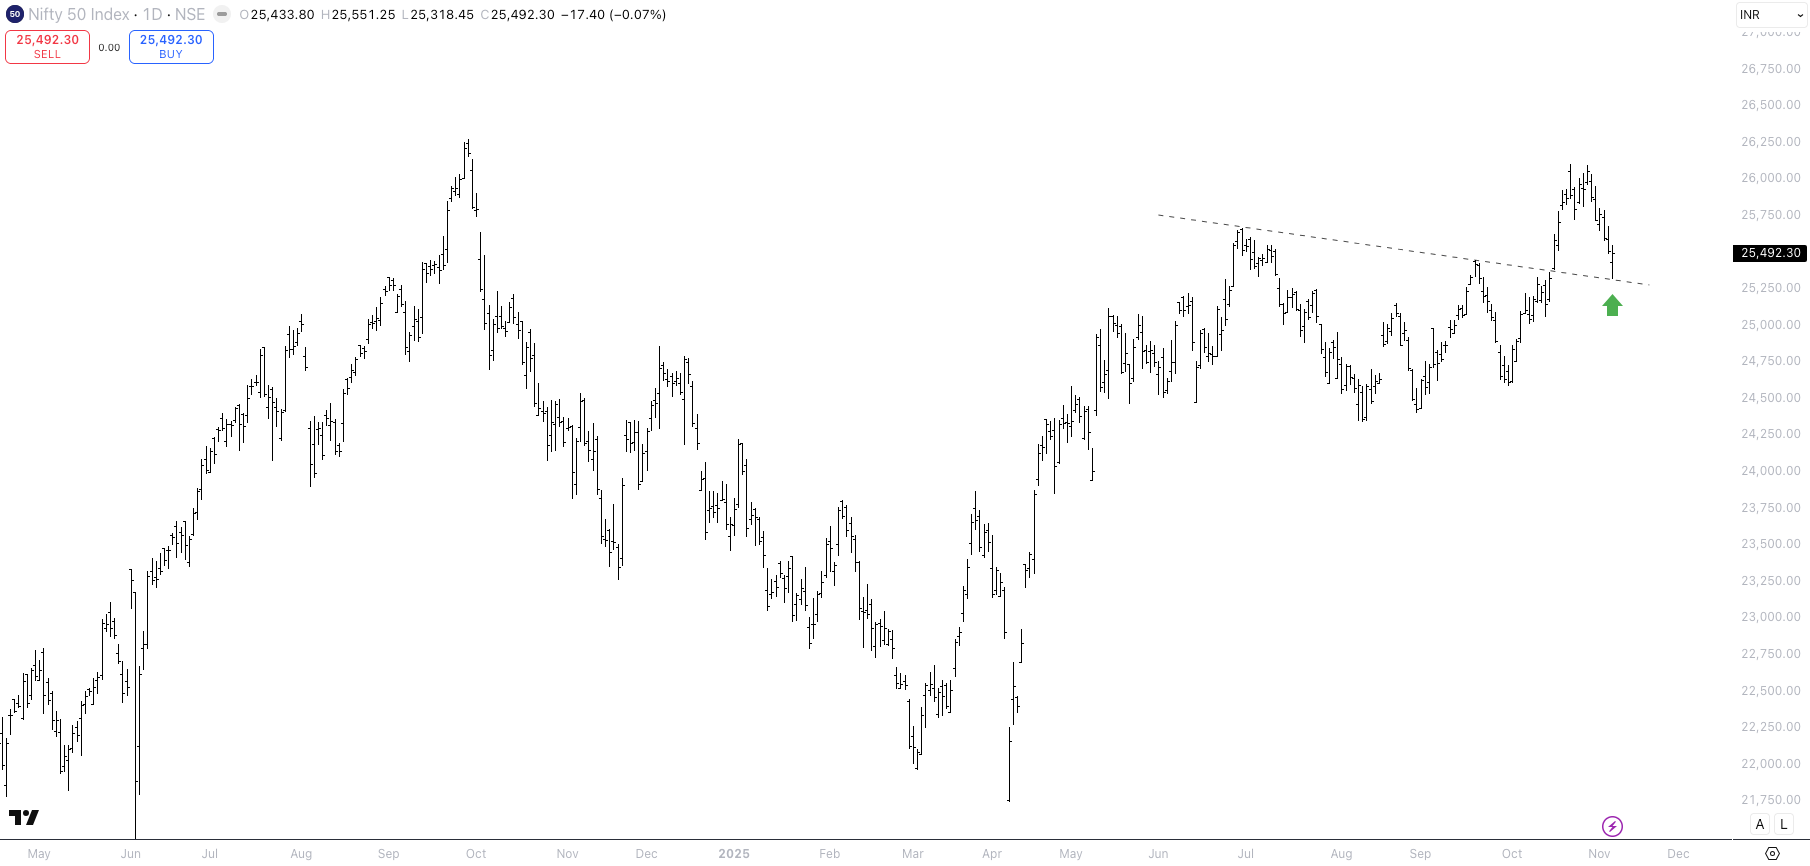
That said, time in the market beats market timing. I’ll likely re-deploy some of that cash early next week, most likely into the S&P 500 and the Indian stock market. The Nifty 50 looks interesting here - it’s retesting its trend line on the daily chart.
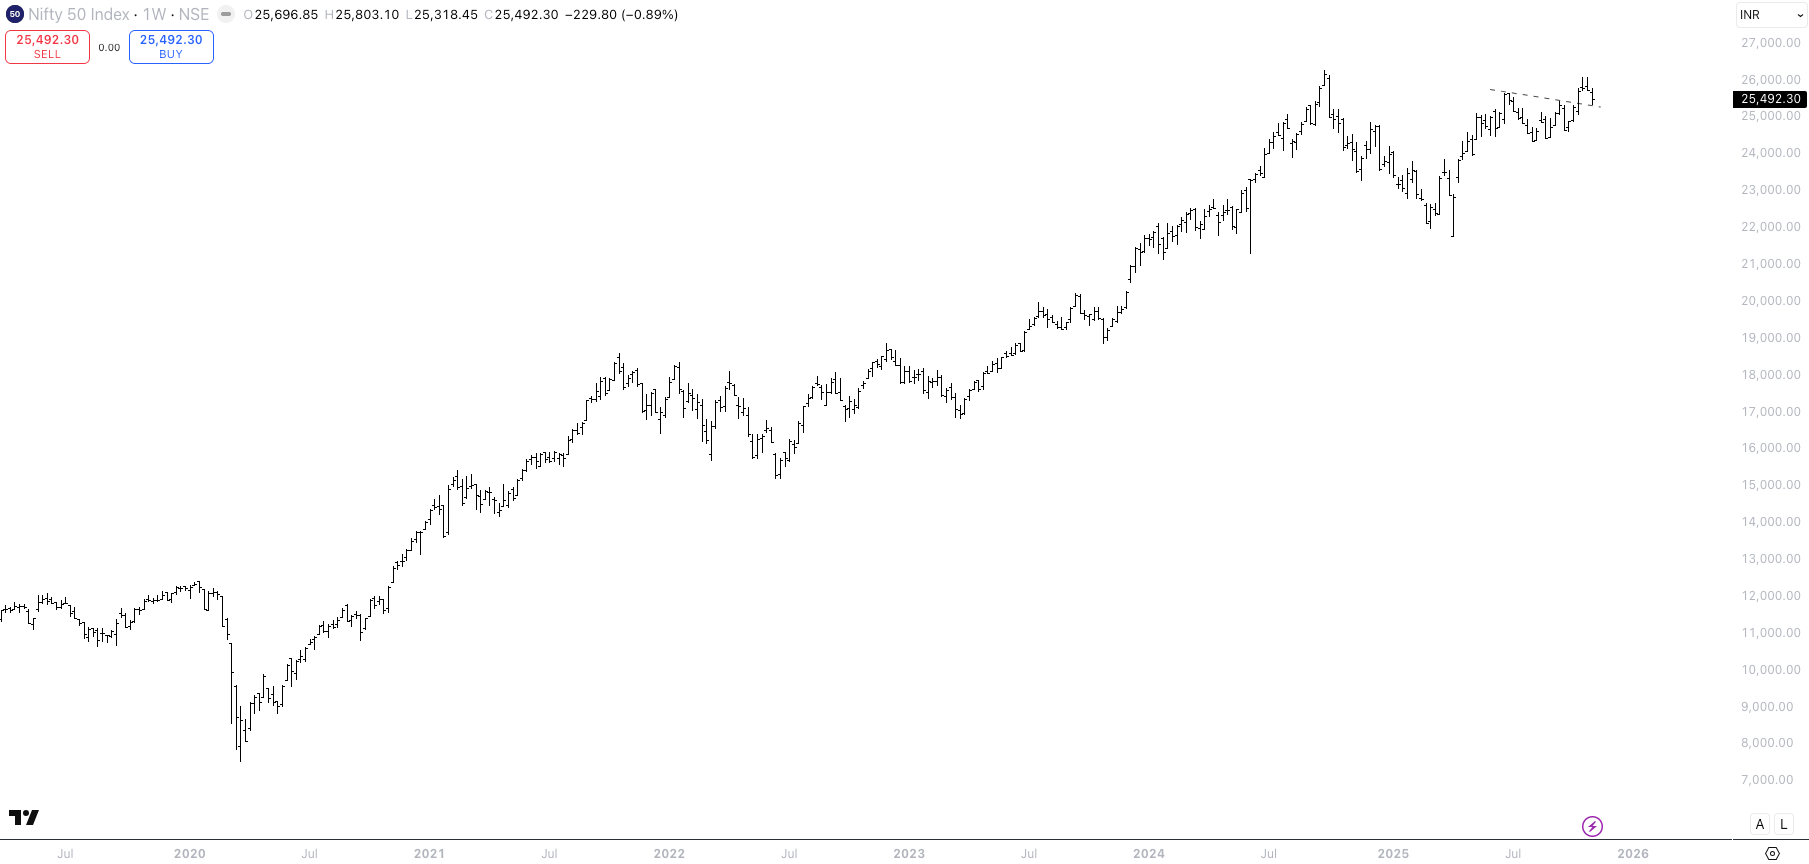
Below is the long-term weekly chart of the Nifty 50 Index, which continues to look structurally strong.
That’s it for this week - I hope you enjoyed the article.
Great piece Mr. Repo, thank you for sharing your thoughts!
Similarly to your case, I closed my long USDCAD trade, giving back probably half of the gains.
I'm still not convinced that it doens't trade lower though, but the thesis has been challenged enough for me to close.
Even if Canada bottoms out, the beta between the US and CAD economy is very strong, and I still believe US outperformance is base case, though maybe that feels a bit more priced in now.
A quick question if possible regarding reserves management and the differences between FED and BoE/ECB.
If I understood correctly, the "supply focus" from the FED refers to setting a level (Around 11% of reserves/GDP) and making sure reserves are at least there, whereas BoE/ECB will be a bit more reactive to REPO market "demands" from different players?
Related, what do you think is the structural pressure in markets from a FED that's slowly going to remove itself from the longer end (likely as treasury rebuilds the coupons/bills ratio) and focus more on money markets/bills? I'm assuming a return to more average steepeness in 2s10s?
Thank you for a great piece!
Best,
Valentino
Do you see the ECB cutting in March if deflation comes in faster than expected in dec and jan? The China dumping goods story seems to be worse than thought, the ECB's paper on it shows that even they got their eyes on it.