
3 Charts that Visualize the Earnings Risk in 2024
Economists expect earnings to grow by 10.2% in 2024. However, a weak Chinese economy and poor readings in several leading economic indicators suggest that earnings could disappoint.

Earnings risk does not get the attention it deserves. For H1-2024, the outlook on liquidity looks favourable (see last week’s Substack). However, a weak Chinese economy and poor readings in several leading economic indicators suggest that earnings could disappoint. I built an earnings model, analysed its individual components and compared it to the street’s consensus forecast. Let’s dive in!
Economists expect earnings to grow by 10.2% in 2024
Economists currently expect earnings per share (EPS) of 238.2 USD for the S&P500 in 2024. This would imply a 10.2% increase compared to 2023. Interestingly, the bottom-up forecasts also highlight a divergence between growth and value, with economists forecasting 21.4% year-over-year EPS growth for the S&P500 Growth Index and only 1.7% year-over-year EPS growth for the S&P500 Value Index.
Given that Q4-2023 results are yet to be disclosed, the consensus projection for the S&P500 EPS in 2023 stands at a modest decline of -3.17%. This contraction is significantly milder than what most investors initially expected. In the beginning of 2023, a recession was for many investors the base case. Historically, earnings drop by roughly 15% in a recession (excluding the GFC: 12.5%).
The expected decline in EPS of -3.17% was an upside surprise to investors and partially explains why the stock market surged in 2023. In the second half of 2022, most investors were too pessimistic. Interest rate hikes from central banks all around the world in combination with geopolitical conflicts had a smaller impact on the US economy than most investors expected.
Earnings Model: Double-digit fall in earnings in 2024?
Some time ago, I was inspired by Morgan Stanley’s Mike Wilson and built my own top-down earnings model for the S&P500. It comprises several leading indicators such as the Chinese credit impulse, the US-dollar, residential fixed investment and more. You can find the most recent forecast below (R Squared of the model is 0.54, t-stats > 3). I winsorized the earnings data and applied a 3-month moving average to the indicators to make the model more robust. However, this also means that the model is likely to undershoot in extreme (positive or negative) scenarios - as you can see in the chart below.
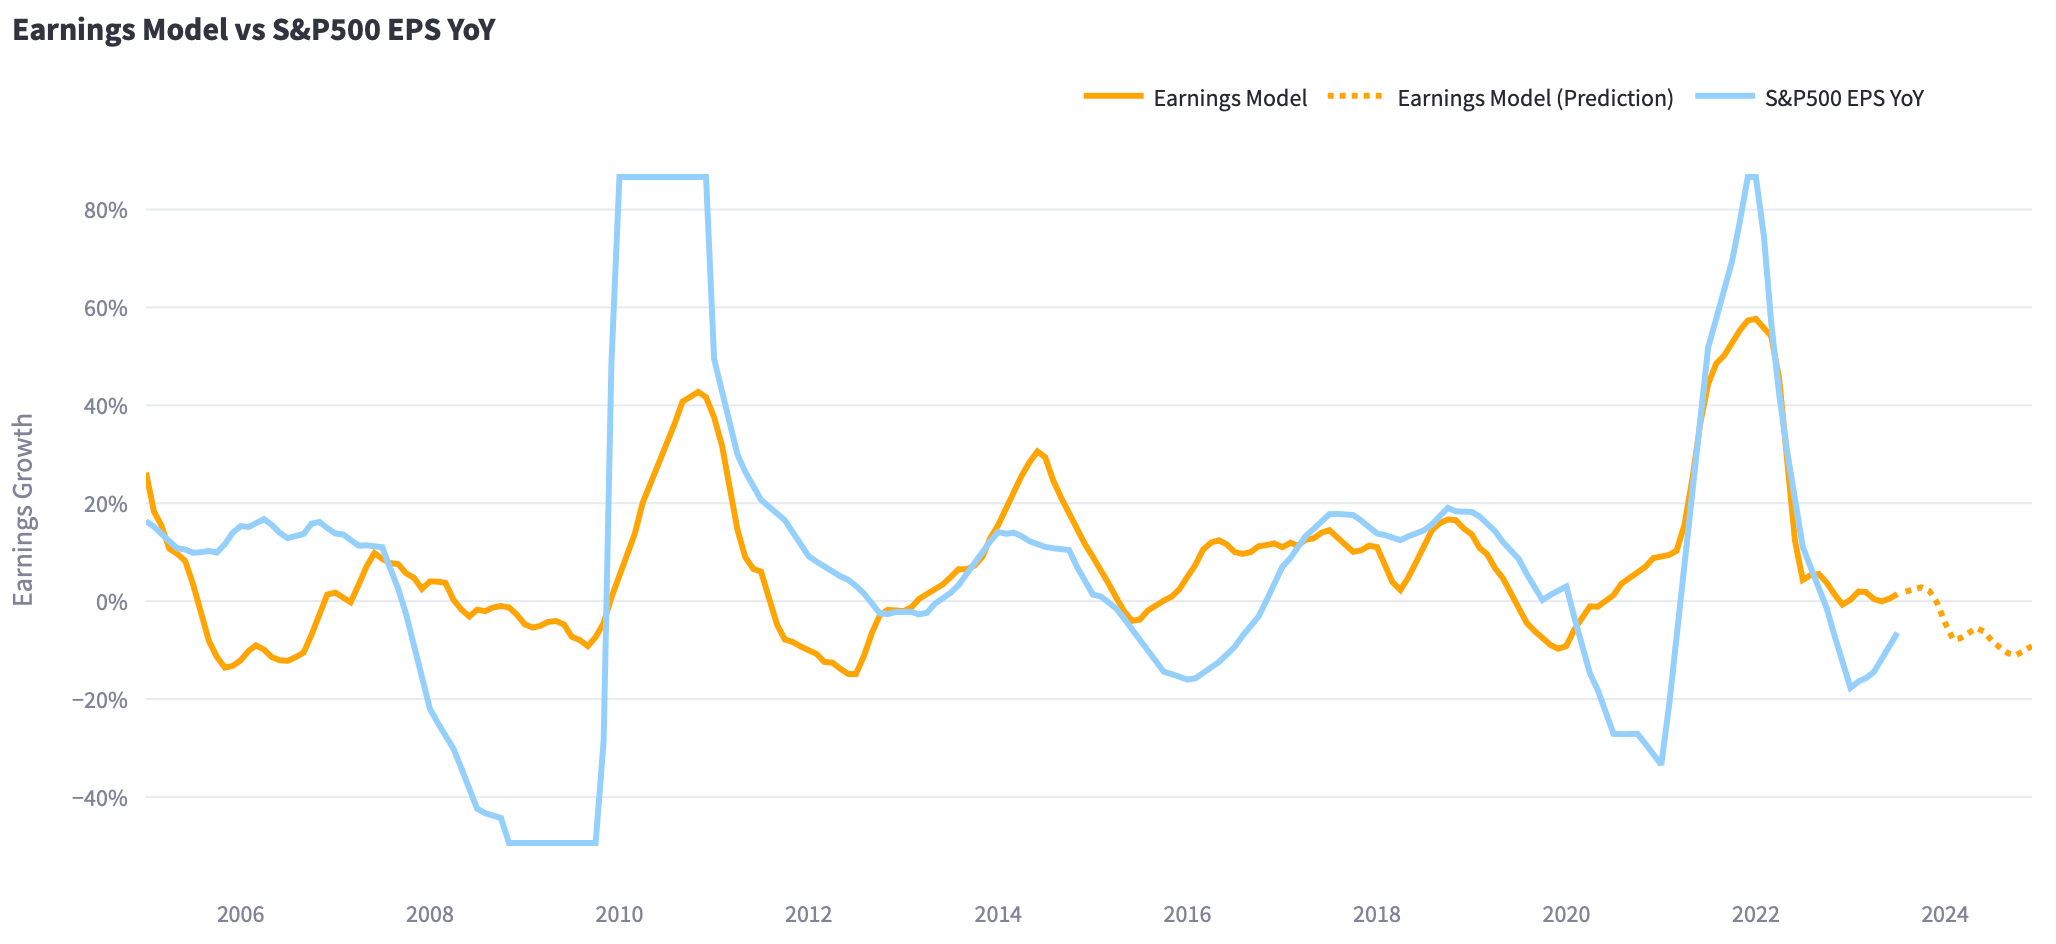
I would not take the model’s prediction at face value. In other words, the prediction that earnings will decline by 10% might very well be wrong. It is extremely difficult to accurately predict where earnings will go over the course of twelve months in an economy that is driven by hundreds of factors. I could also have shown you a model that fits historical earnings growth a lot better (R Squared of > 0.8), but severely overfits the data and inspires wrong confidence. Instead of trying to forecast the exact growth rate, I am more interested in the overall direction the model predicts. At the moment, the model’s prediction (-10%) and the economists forecasts (+10%) could not be more different.
I dived into some of the model’s components to understand what drives the divergence and the more negative outlook of the earnings model. There are a few indicators that should cause some concern and likely limit the upside to earnings growth in 2024. Noteworthy: In the charts below, outliers during the GFC were removed.
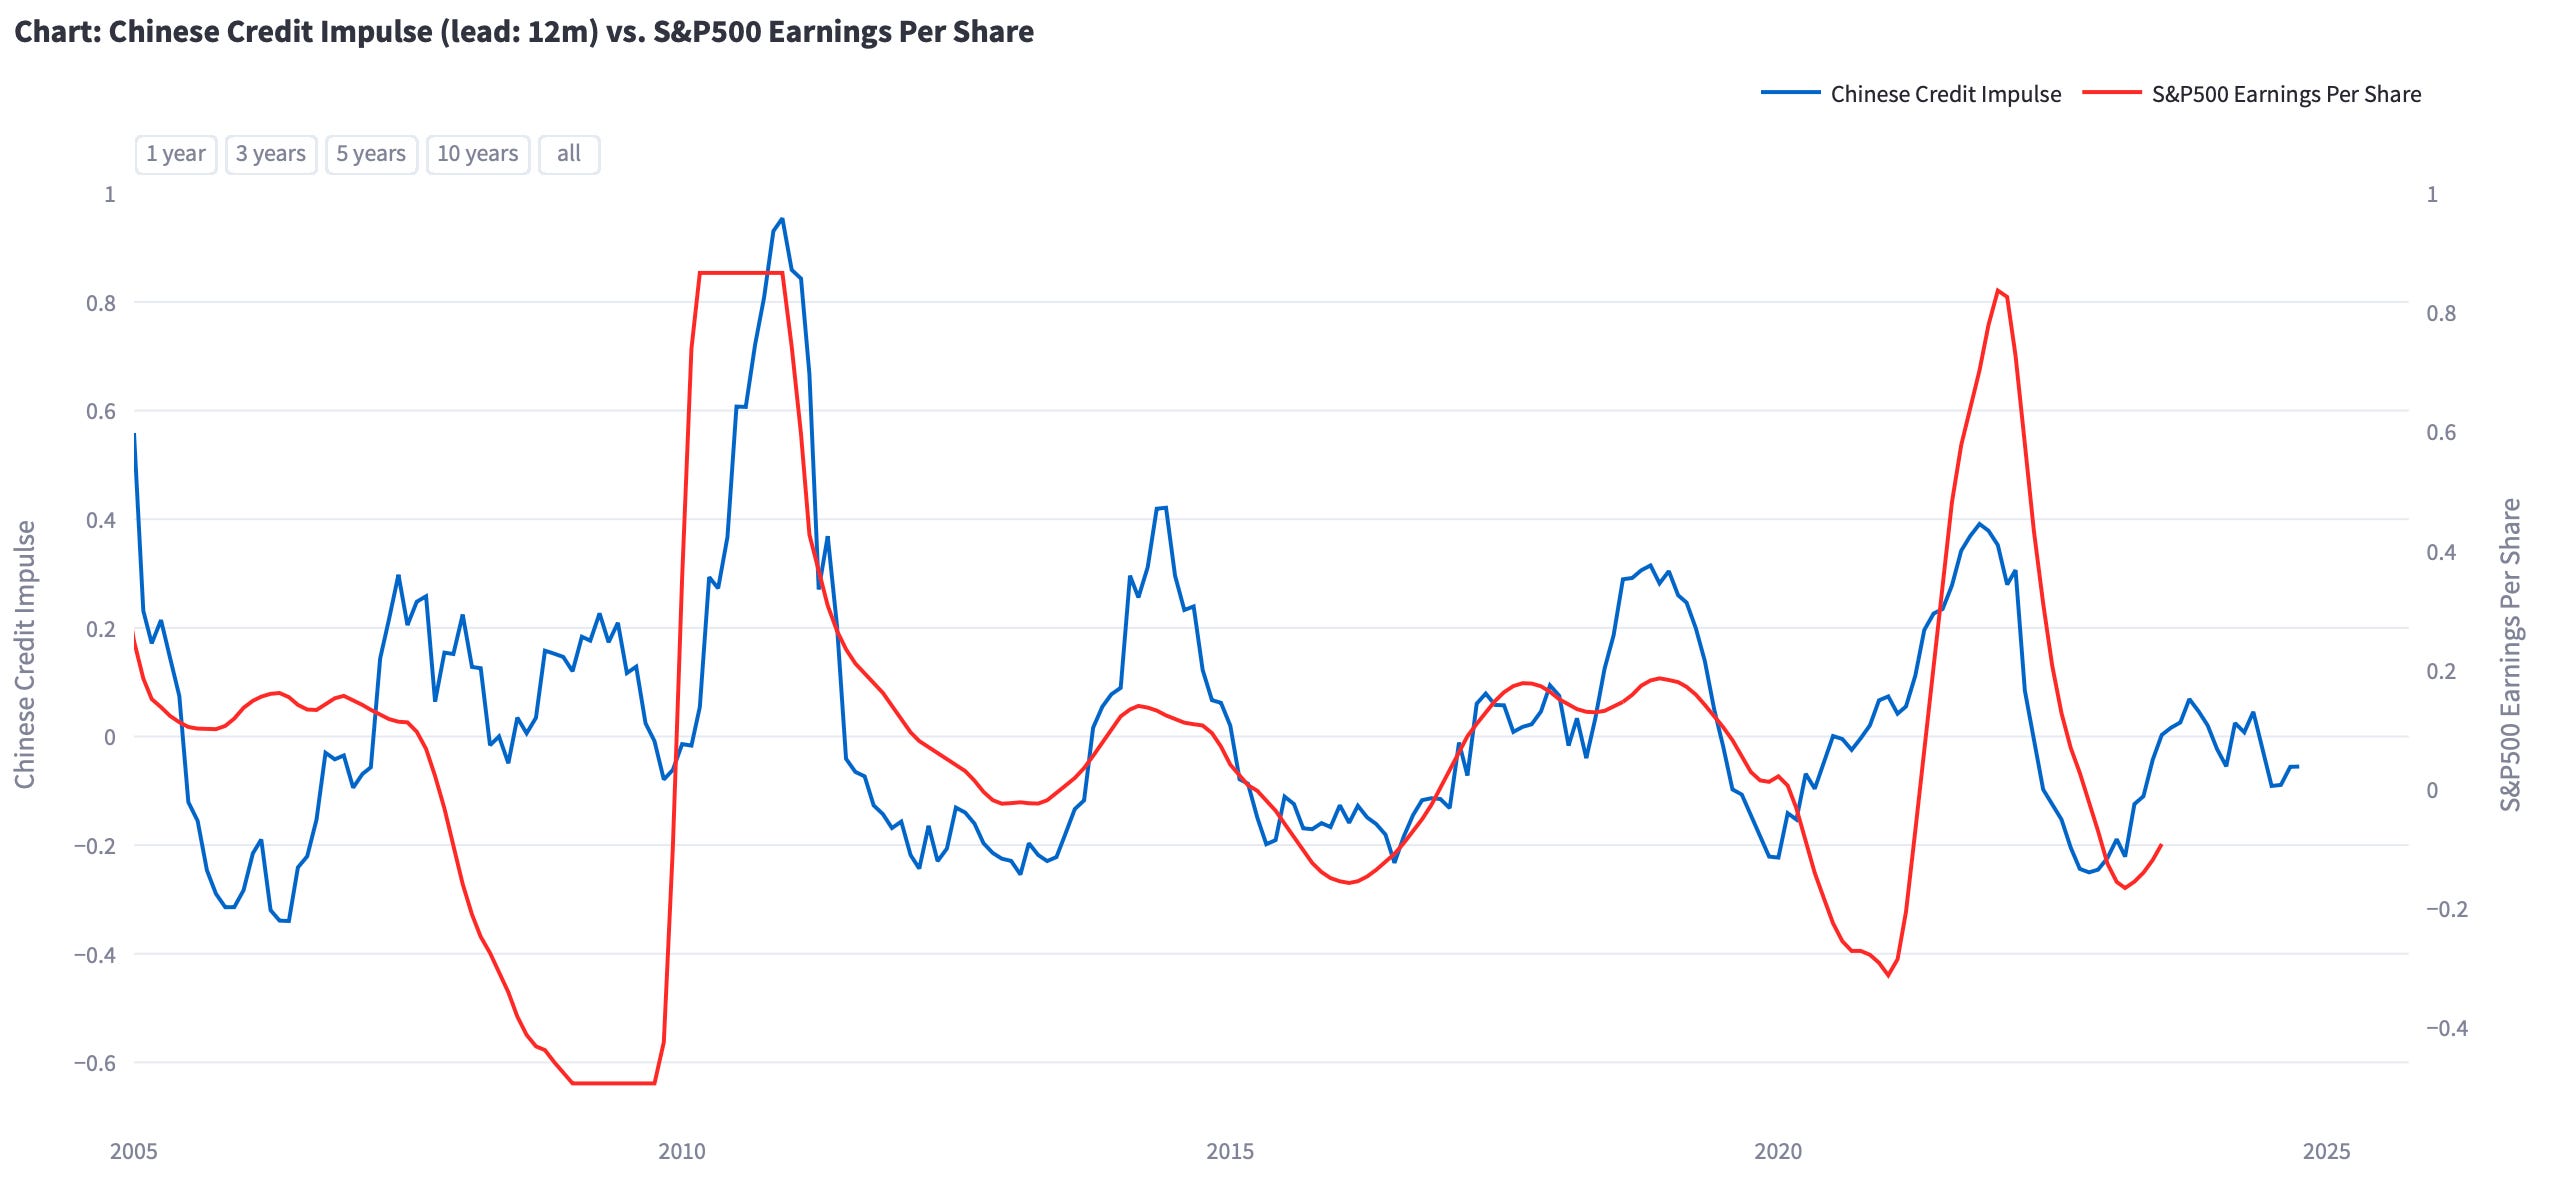
Component 1: Chinese Credit Impulse
When you shift the Chinese credit impulse forward by 12 months and then calculate its correlation with EPS growth in the S&P500 since 2004, you’ll get 0.44. Not bad, eh? Earnings growth in the S&P500 seems to be driven to a large extend by how much credit is created in the Chinese economy. However, the Chinese credit impulse did not go anywhere in the past few months and according to Bloomberg “Chinese Premier Li Qiang gave his clearest signal yet (in Davos at the WEF) that Beijing won’t resort to huge stimulus to revive growth amid the worst bout of deflation in decades”. This does not speak for dynamic EPS growth in the 10+% area.
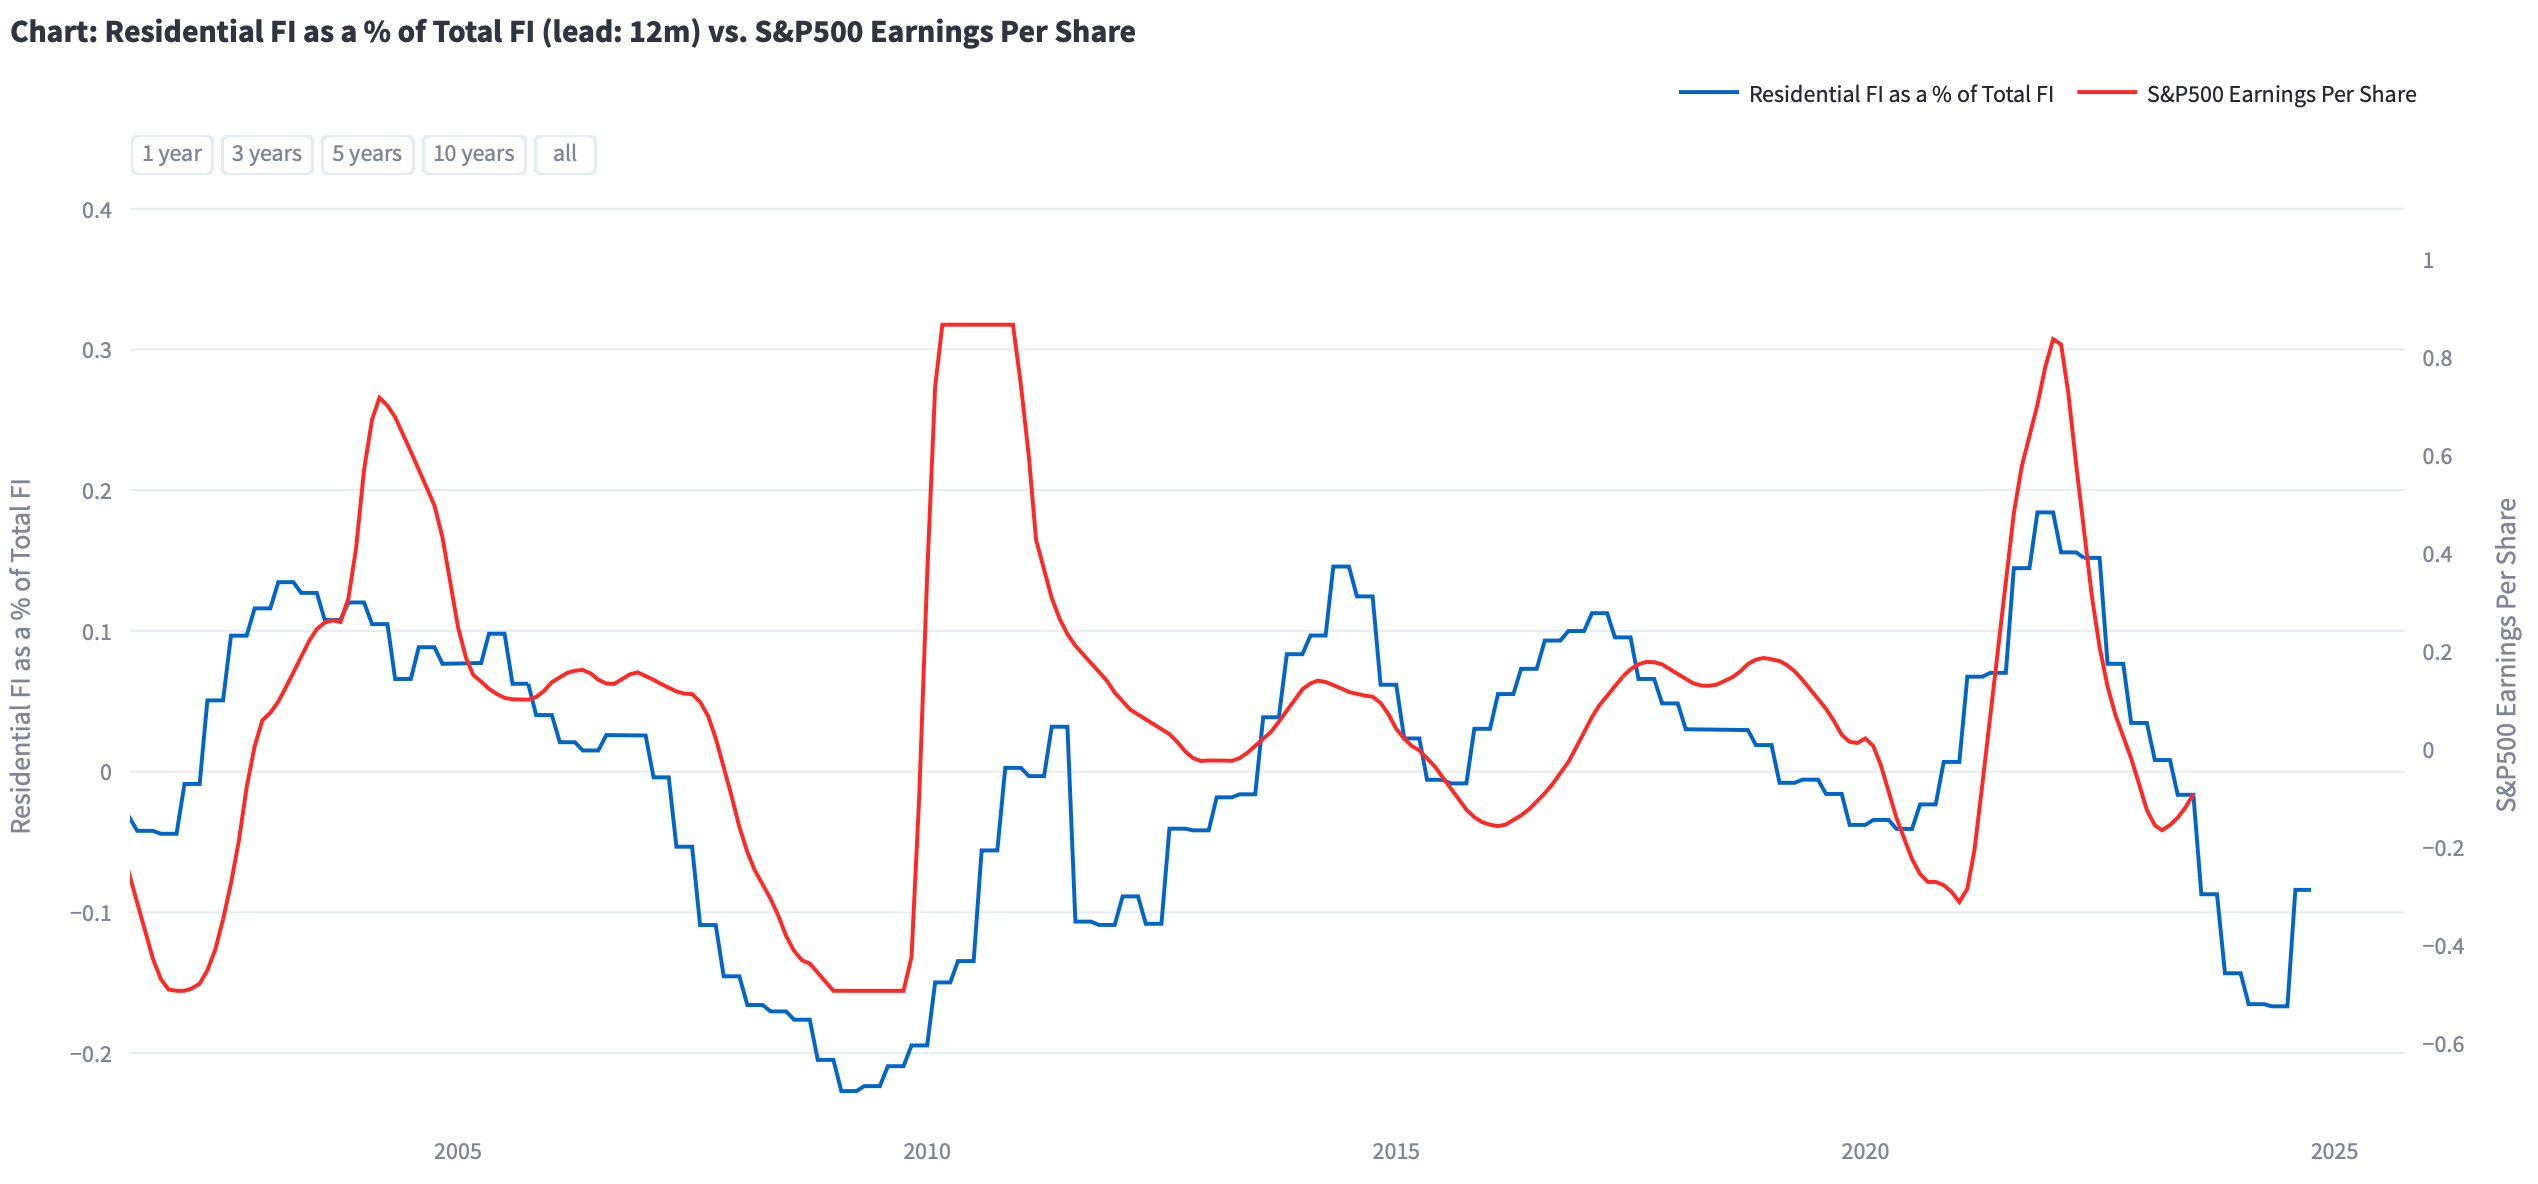
Component 2: Residential Fixed Investment as a % of Total Fixed Investment
The year-over-year rate of change in residential fixed investment as a percentage of total fixed investment (12-month lead) is also a great indicator to predict EPS growth in the US. Both time series have a correlation of 0.33. The chart below highlights that higher interest rates and consequently lower residential fixed investment will weigh on earnings in the next 2-3 quarters. However, this indicator should start to increase once the Federal Reserve starts cutting interest rates (likely this year) and activity in residential real estate picks up.
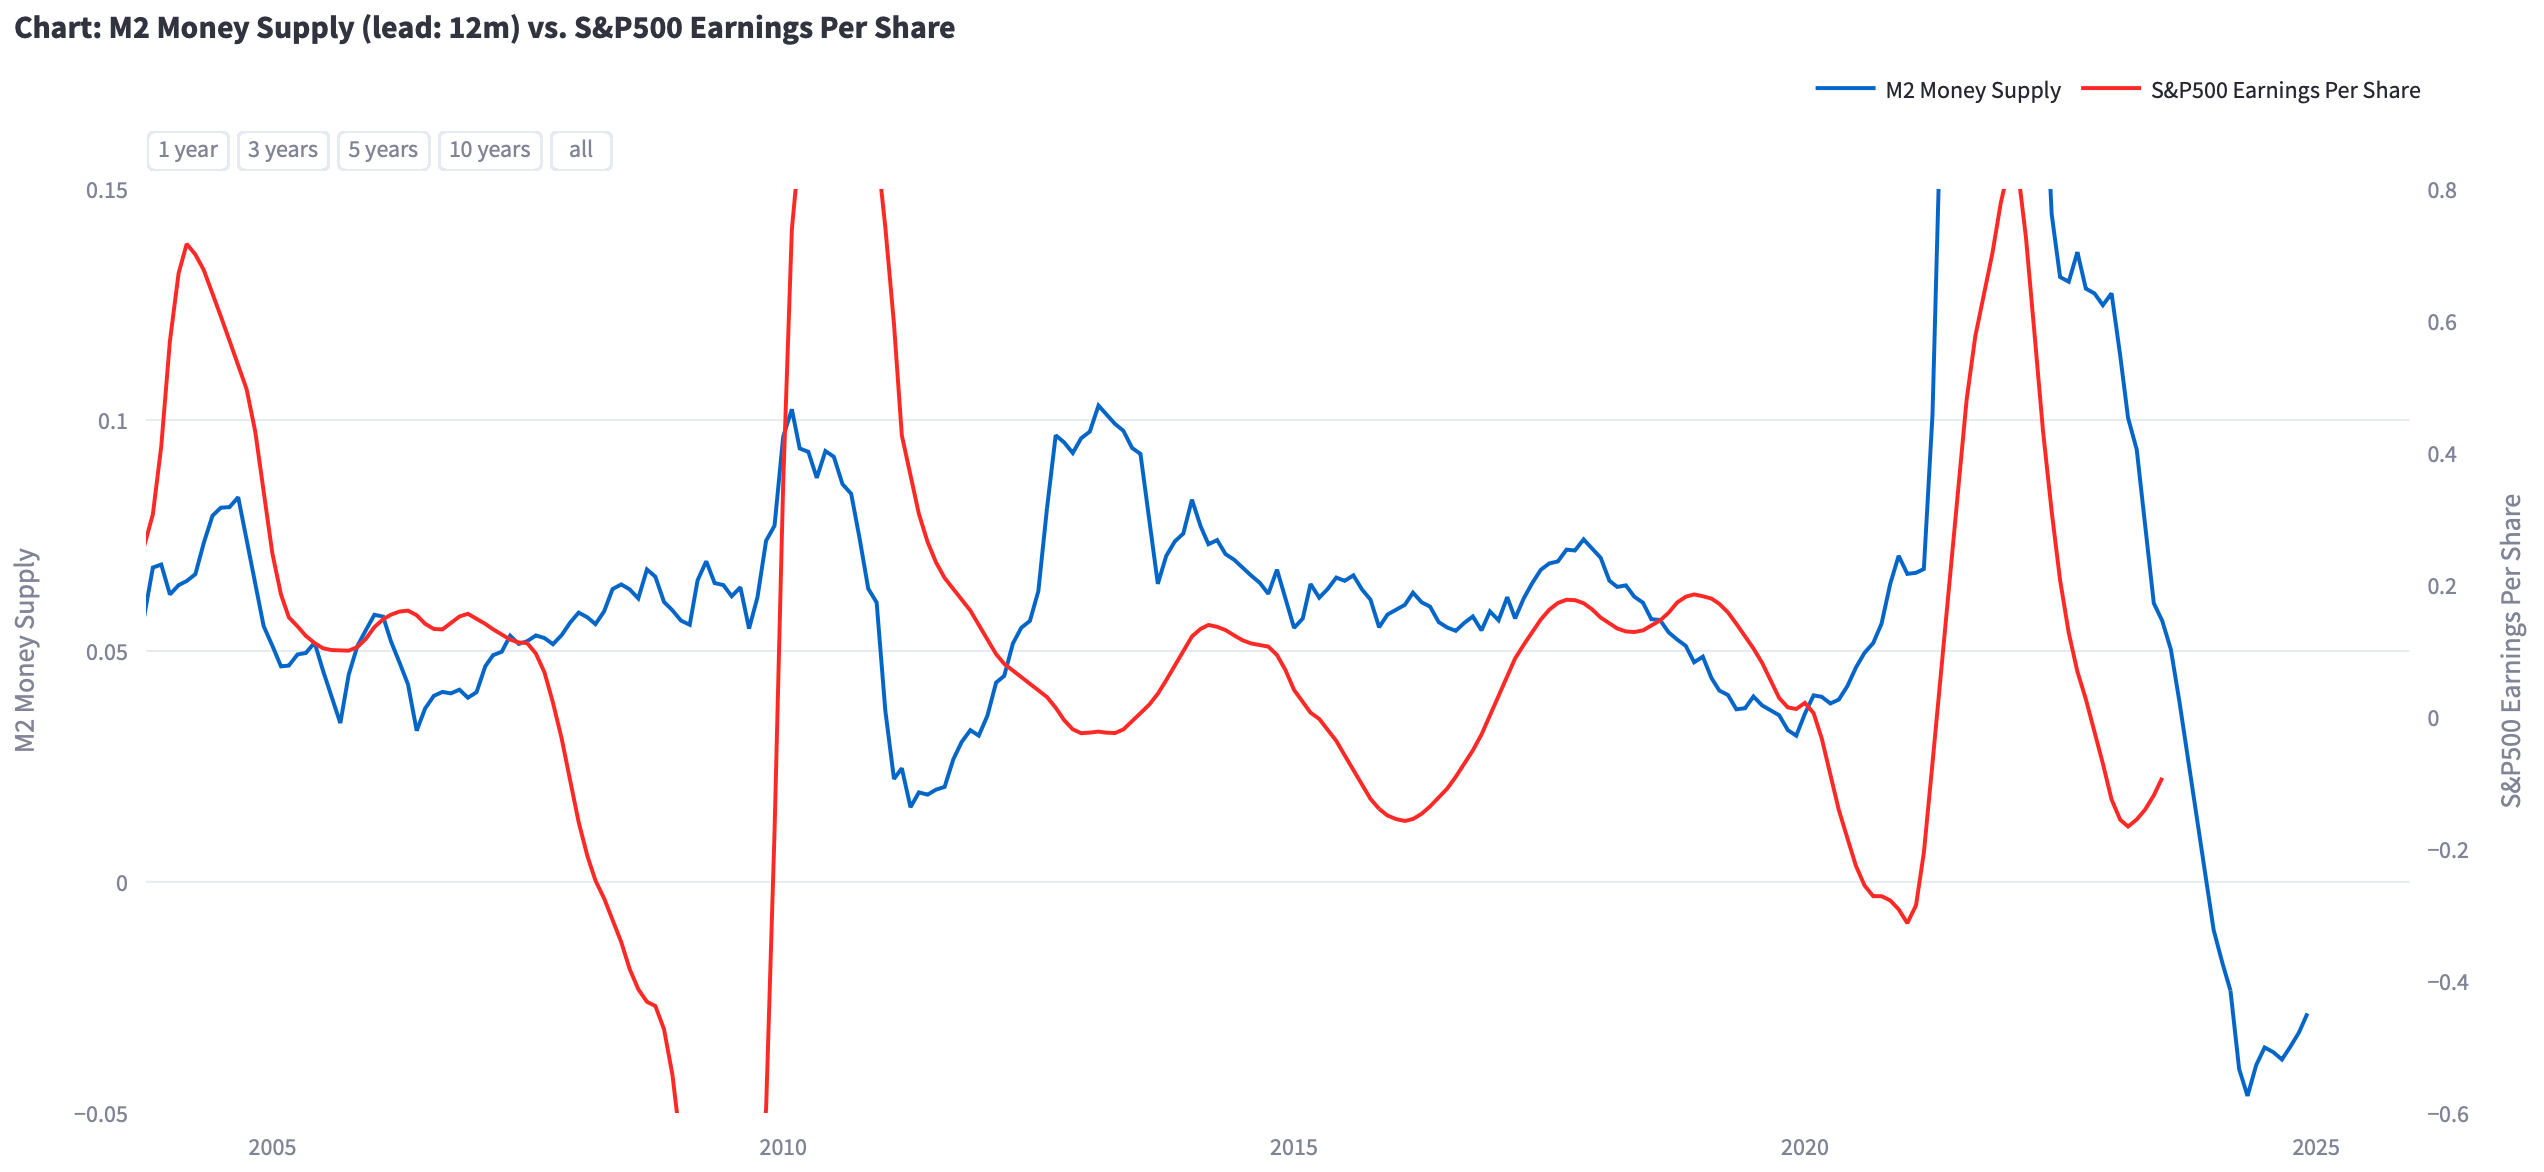
Component 3: M2 Money Supply YoY
There is always lots of discussion about M2 money supply and whether it is the correct measure of money in circulation. I used it mostly because it is convenient and the year-over-year rate of change shifted forward by 12 months and EPS growth have a correlation of 0.4. That is pretty good, in fact, a lot better than most other leading indicators such as the ISM Manufacturing PMI. At the moment, the decline in M2 money supply suggests further downside in earnings or potentially limits the upside in EPS growth.
Earnings Determine Stock Market Performance
“I can't say enough about the fact that earnings are the key to success in investing in stocks. No matter what happens to the market, the earnings will determine the results.” - Peter Lynch
Earnings growth in the US economy is likely going to be dampened by a weaker Chinese economy, weaker residential fixed investment and restrictive monetary policy. This might not be fully reflected in the consensus forecast for 2024 and could lead to downside earnings surprises - especially in H1-2024. The upcoming earnings season will likely reveal whether expectations are too optimistic.
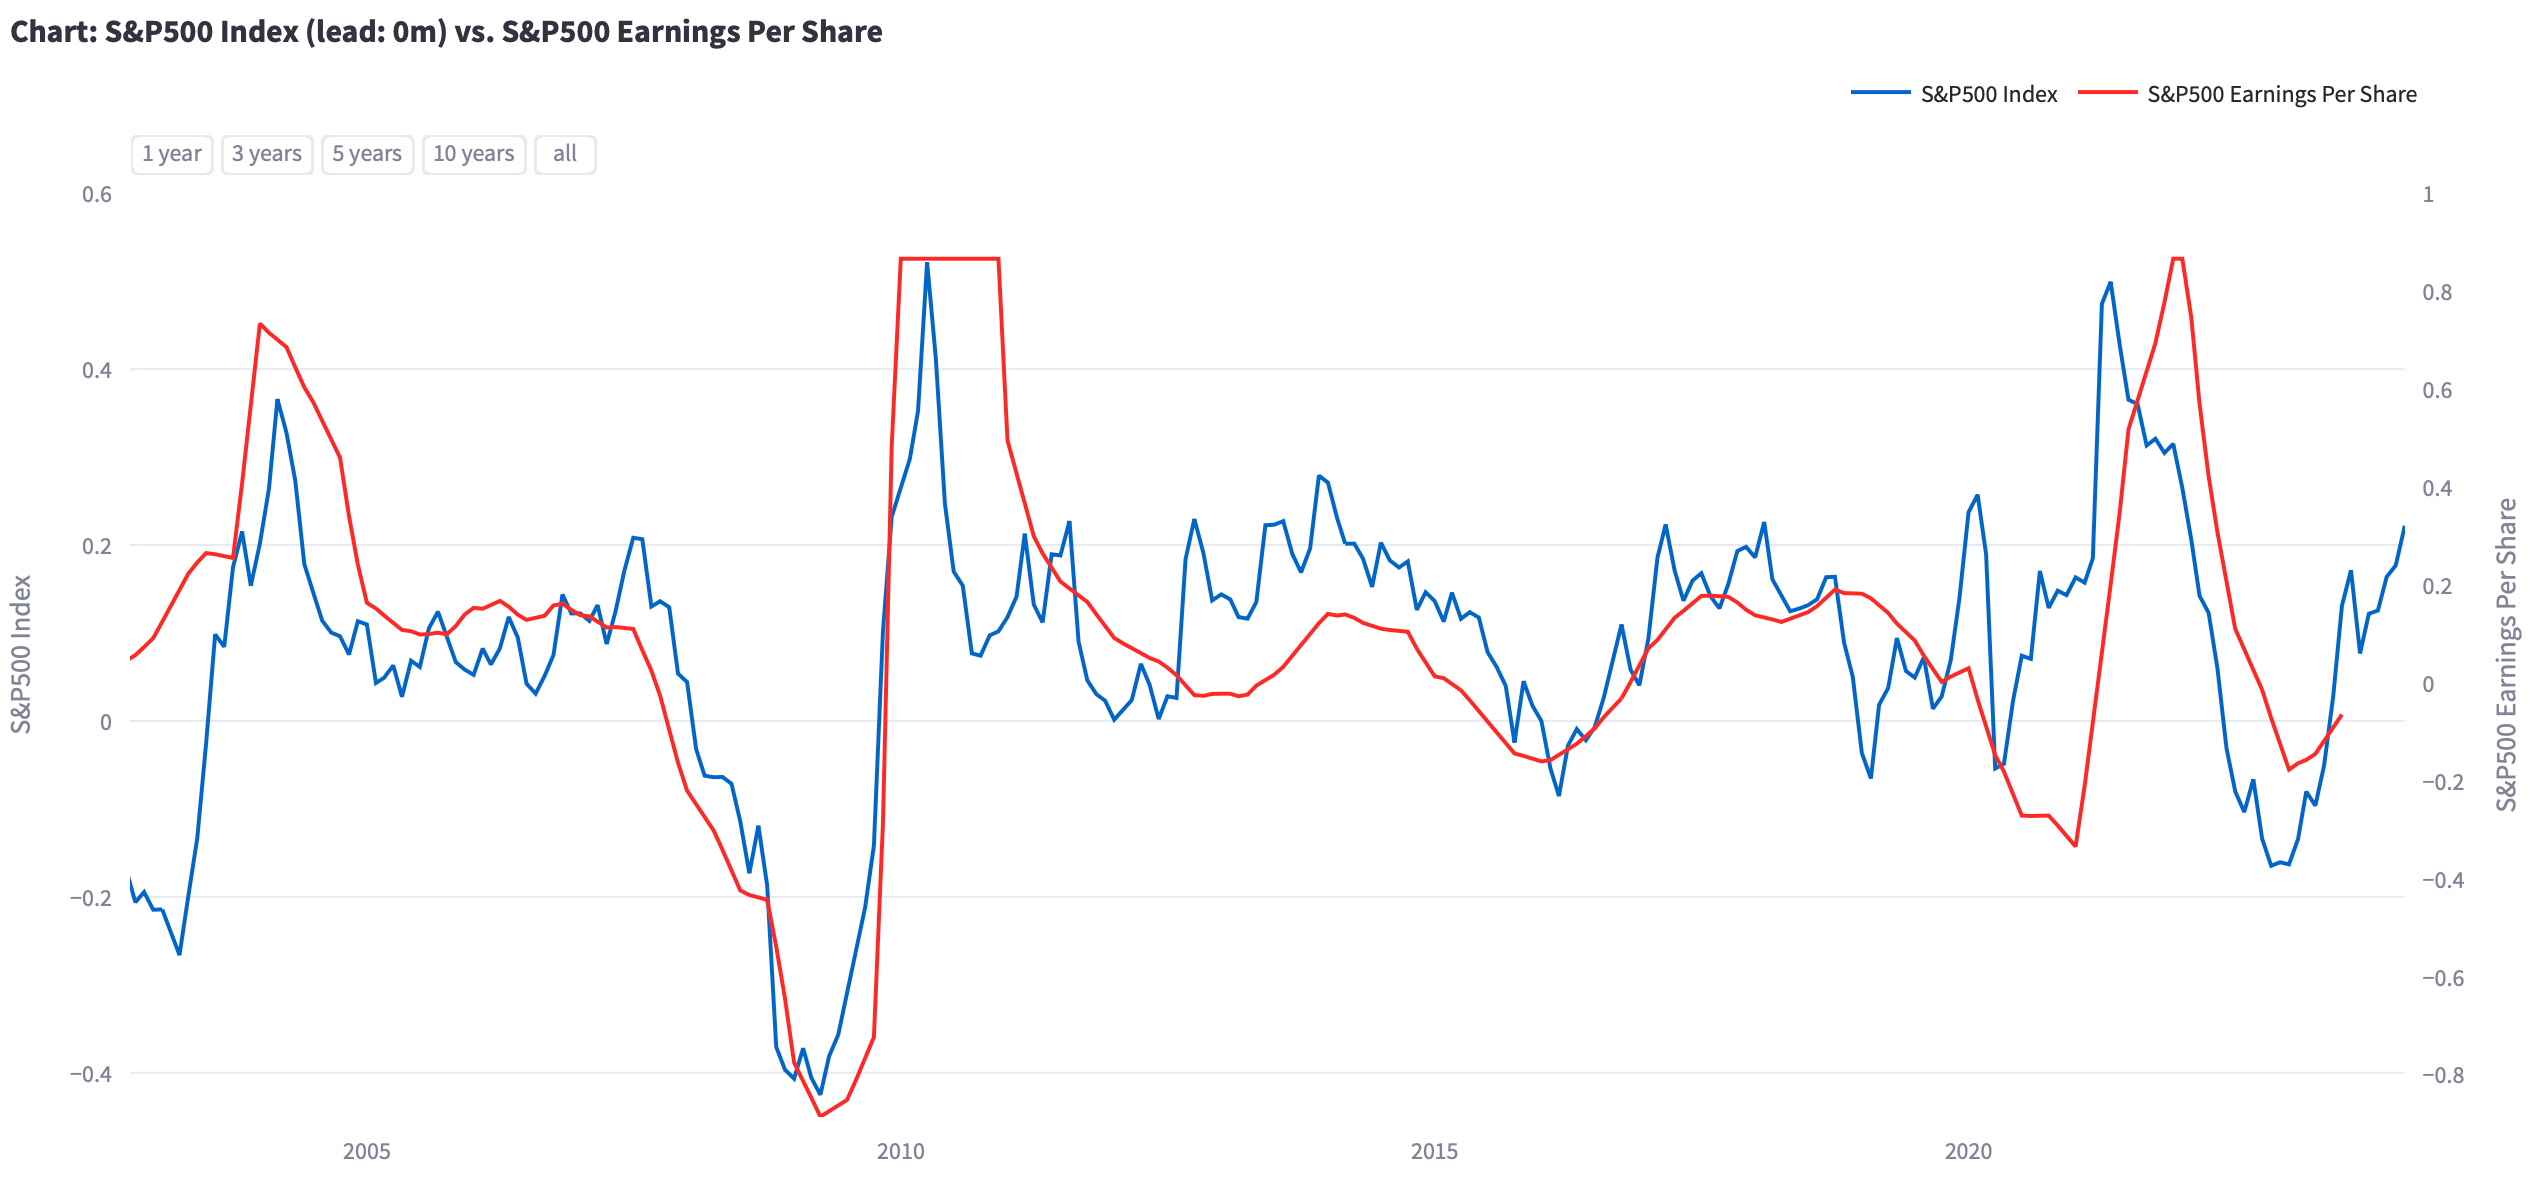
Leading indicators suggest that the drag on earnings is going to be most strongly felt in Q2-2024 and Q3-2024. This could speak for a sideways moving stock market in the first half of 2024. When we compare the S&P500’s most recent year-over-year performance with its year-over-year EPS growth, there seems to be a disconnect. Either earnings pick-up or the S&P500 slows down.
The outlook on earnings does not suggest that the stock market is going to crash. For example, the earnings of the “Magnificent 7” are likely not driven by the factors in the model. In addition, the market is a discounting mechanism and looks ahead. At the moment, the market is pricing in several rate cuts, reflecting optimism about improving economic conditions that would also result in upside for earnings growth. The stock market might just need a break.
I hope this report was interesting and you could learn something. I am planning on publishing more thoughts and analyses in the future, so feel free to subscribe to my Substack and Twitter. It is all for free! I will also talk about other market-related topics and publish the predictions of some of my financial models!